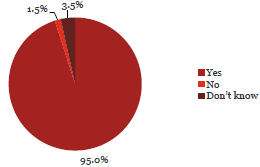
17. The culture at my organisation is such that I would be willing to raise any concerns that I may have regarding fraud or corruption and I know that my concerns will be taken seriously and I would not suffer any retaliation.
Observation:

95% indicated that they worked in a sufficiently safe environment in which to raise concerns.
Like the previous question, confidence was high across all positions and sectors that organisations did encourage staff to come forward and report their concerns for fraud.
What some respondents have said:
“I'm not aware of all of the options for reporting fraud, but it's not something I've ever seen here and so I'm not overly concerned about it. If I was concerned about something I think that I would feel comfortable expressing my concerns.”
“I believe we have a good culture in relation to preventing and reporting of potential or actual fraud.”
“It is poor and there have been a number of things that senior management are aware off but have not followed through with an investigation. They don't take it seriously or see the flow on effects.”
“As personal circumstances are challenged staff may resort to fraudulent acts. A staff member has come forward to self report a time when she felt that she was tempted to try and use her fuel card for her own use because of her personal circumstances. This was checked but we found that no fraud had been committed.”
| Yes | No | Don’t know | Total Count | ||||
|---|---|---|---|---|---|---|---|
| Chief Executive Officer/Managing Director/Principal | 379 | 99% | 0 | 0% | 4 | 1% | 383 |
| Member of the senior executive/leadership team or equivalent | 470 | 96% | 8 | 2% | 12 | 2% | 490 |
| Line manager (if not one of the above) | 205 | 94% | 6 | 3% | 8 | 4% | 219 |
| Administration/Support Services | 185 | 93% | 3 | 2% | 12 | 6% | 200 |
| Operational staff (e.g. Teacher, Analyst, Advisor, Technician, Officer, Engineer, Accountant) | 118 | 87% | 4 | 3% | 14 | 10% | 136 |
| Total | 1,357 | 95% | 21 | 1% | 50 | 4% | 1,428 |
| Yes | No | Don’t know | Total Count | ||||
|---|---|---|---|---|---|---|---|
| Central Government | |||||||
| Autonomous Crown Entities | 53 | 98% | 1 | 2% | 0 | 0% | 54 |
| Central Government - Other | 45 | 100% | 0 | 0% | 0 | 0% | 45 |
| Crown Agents or Companies | 85 | 98% | 0 | 0% | 2 | 2% | 87 |
| Crown Research Institutes | 37 | 97% | 0 | 0% | 1 | 3% | 38 |
| District Health Boards | 62 | 89% | 3 | 4% | 5 | 7% | 70 |
| Government Departments | 138 | 95% | 3 | 2% | 5 | 3% | 146 |
| Independent Crown Entities | 36 | 97% | 0 | 0% | 1 | 3% | 37 |
| Māori Trust Boards | 11 | 100% | 0 | 0% | 0 | 0% | 11 |
| Rural Education Activities Programmes | 11 | 100% | 0 | 0% | 0 | 0% | 11 |
| State-Owned Enterprises | 44 | 94% | 1 | 2% | 2 | 4% | 47 |
| Tertiary Education Institutions | 82 | 90% | 4 | 4% | 5 | 5% | 91 |
| Sub-Total | 604 | 95% | 12 | 2% | 21 | 3% | 637 |
| Yes | No | Don’t know | Total Count | ||||
|---|---|---|---|---|---|---|---|
| Local Government | |||||||
| Airports | 16 | 84% | 0 | 0% | 3 | 16% | 19 |
| Council Controlled Organisations or Council Controlled Trading Organisations | 74 | 99% | 0 | 0% | 1 | 1% | 75 |
| Energy Companies | 26 | 93% | 0 | 0% | 2 | 7% | 28 |
| Fish and Game Councils | 8 | 100% | 0 | 0% | 0 | 0% | 8 |
| Licensing and Community Trusts | 9 | 100% | 0 | 0% | 0 | 0% | 9 |
| Local Authorities | 154 | 91% | 5 | 3% | 10 | 6% | 169 |
| Local Government - Other | 11 | 100% | 0 | 0% | 0 | 0% | 11 |
| Port Companies | 2 | 100% | 0 | 0% | 0 | 0% | 2 |
| Sub-Total | 300 | 93% | 5 | 2% | 16 | 5% | 321 |
| Schools | 453 | 96% | 4 | 1% | 13 | 3% | 470 |
| Total | 1,357 | 95% | 21 | 1% | 50 | 4% | 1,428 |

