Part 3: Schools in financial difficulty
3.1
In this Part, we describe:
- the financial health of schools;
- the effect of the Covid-19 pandemic on school finances; and
- schools we consider to be in financial difficulty.
3.2
In this Part, the data we provide is based on 2021 financial information that the Ministry of Education collected as at 31 December 2022, unless otherwise stated. The Ministry’s database had financial information for 1981 schools (80% of all schools). We have also used the 2020 and 2019 financial information from the Ministry’s database, unless otherwise stated.
The financial health of schools
3.3
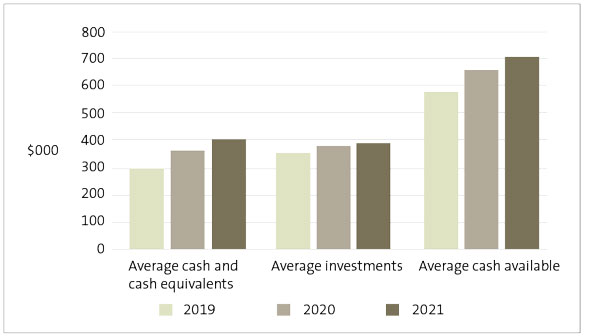
Figure 5 summarises the average levels of cash and investments held by schools as at 31 December 2019, 2020, and 2021. Cash and cash equivalents are bank accounts and short-term deposits that are held for 90 days or less. Investments held by schools are typically longer-term deposits. As at 31 December 2021, there had been an increase in average cash and cash equivalents ($401,536) and average investments ($387,273) held by schools compared to the previous years.
Figure 5
Average cash and investments held by schools, from 2019 to 2021
Source: The Ministry of Education’ school financial information database.
3.4
When reviewing the financial position of a school, it is important to consider their available cash. Schools often hold funds on behalf of third parties, including for capital projects they are managing for the Ministry of Education, homestay payments for international students, or on behalf of other schools in “cluster”-type arrangements, such as transport networks. The total cash a school holds, excluding the amount held for third parties, is considered “available cash” for the school board. In 2021, average available cash increased to $702,335 (as at 31 December 2021) from $652,257 (as at 31 December 2020).
3.5
Figure 6 shows that a school’s decile does not affect how much available cash it has. The number of schools from each decile are fairly evenly spread for each range of available cash.
Figure 6
Number of schools by decile that hold different levels of available cash, as at 31 December 2021
For each range of available cash, the number of schools in each decile is fairly evenly spread. Available cash is total cash and investments less any cash held for third parties, such as funds the school holds on behalf of the Ministry for capital works.
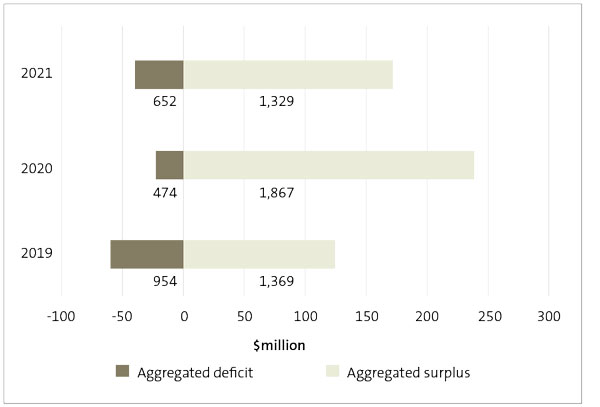
| Decile | Available cash ($000) | ||||||
|---|---|---|---|---|---|---|---|
| <0 | <100 | <200 | <300 | <500 | <1,000 | >1,000 | |
| Decile 1 | 0 | 14 | 18 | 19 | 43 | 50 | 54 |
| Decile 2 | 0 | 13 | 34 | 28 | 31 | 56 | 37 |
| Decile 3 | 1 | 14 | 28 | 31 | 41 | 46 | 42 |
| Decile 4 | 1 | 16 | 33 | 27 | 45 | 58 | 29 |
| Decile 5 | 2 | 18 | 43 | 31 | 40 | 53 | 26 |
| Decile 6 | 0 | 19 | 36 | 23 | 31 | 29 | 39 |
| Decile 7 | 3 | 20 | 36 | 33 | 39 | 36 | 40 |
| Decile 8 | 0 | 25 | 31 | 28 | 29 | 41 | 35 |
| Decile 9 | 0 | 10 | 33 | 32 | 34 | 52 | 29 |
| Decile 10 | 2 | 9 | 27 | 31 | 37 | 56 | 34 |
| Total | 9 | 158 | 319 | 283 | 370 | 477 | 365 |
Source: The Ministry of Education’s school financial information database.
3.6
As well as holding cash for others, schools might also allocate cash and investments for a particular purpose, such as a future-building project, school trip, or to pay outstanding bills. Therefore, when we consider whether a school is in financial difficulty, we also consider its working capital position (its available funds excluding the amounts due to be paid to others in the next 12 months).
3.7
As at 31 December 2021, we identified 34 schools with a working capital deficit. This is less than the 53 schools we identified with a working capital deficit in 2020. We discuss working capital deficits in paragraph 3.25.
The effect of the Covid-19 pandemic on school finances
3.8
In 2021, schools continued to be affected by the Covid-19 pandemic because they had to sometimes close for face-to-face learning during the year. Significant numbers of staff were also absent because of illness.
Locally raised funds
3.9
Many schools rely on raising funds locally for funding some of their operations. These funds can be from donations, grants, parent contributions for curriculum recoveries or activities, trading revenue, fundraising, and other revenue, such as rent for school houses and revenue from use of the school hall.
3.10
There was an overall reduction in locally raised funding in 2020 because Covid-19 lockdowns and related uncertainties made it difficult for schools to carry out normal fundraising activities.
3.11
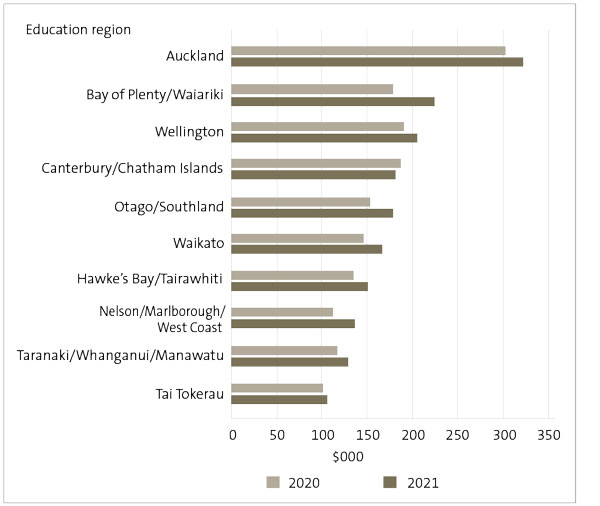
Figure 7 shows that, in 2021, the average amount of locally raised funds for each school increased slightly for all regions except for Canterbury/Chatham Islands. This was because lockdowns were lifted and schools could resume fundraising (with some restrictions).
3.12
The donations scheme was introduced in 2020 for decile 1 to 7 schools. This scheme gives schools $150 for each student if the school agrees not to ask parents for donations (except for overnight trips such as school camps). In 2021, 95% of eligible decile 1 to 7 schools opted into the scheme (compared with 94% in 2020).4
Figure 7
Average locally raised funds (excluding international student revenue) for each school by region
Source: The Ministry of Education’s school financial information database.
3.13
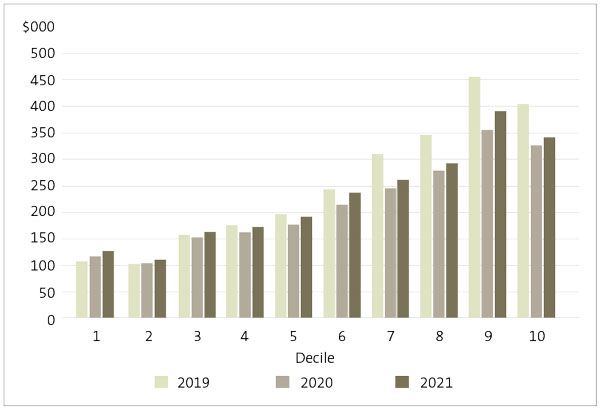
Figure 8 shows that, in 2021, all deciles had an increase in locally raised funds (including in donations scheme funding) compared to 2020. Figure 8 also shows that the trend across 2019, 2020, and 2021 for decile 1 to 7 schools is reasonably consistent with the decile 8 to 10 schools.
Figure 8
Average locally raised funds plus donations scheme funding for each school, by decile
Source: The Ministry of Education’s school financial information database and Ministry-published listing of schools that have opted into the donations scheme.
International student revenue
3.14
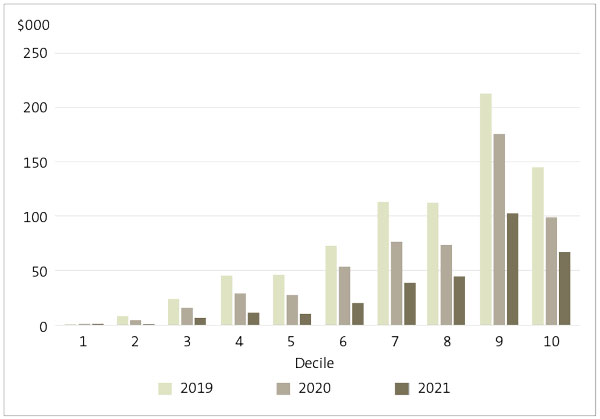
Many schools retained their international students in 2020 even though the borders closed in March of that year. In 2020, the total revenue that schools received from international students reduced by $40 million (26%) from 2019. Figure 9 shows that, in 2021, revenue from international students reduced even further. This was a result of the border being closed for a full year in response to the Covid-19 pandemic.
3.15
Figure 9 shows the reduction in average international student revenue for each school by decile.
Figure 9
Average international student revenue for each school by decile
Source: The Ministry of Education’ school financial information database.
3.16
Schools usually record significant surpluses on international student revenue because the related expenses are small compared with the fees charged. In 2021, 307 schools reported a total surplus on international student revenue of $29 million (an average surplus of $94,000 for each school). In 2020, schools reported a surplus on international student revenue of $63 million (an average surplus of $124,000 for each school).
3.17
The effects of the Covid-19 pandemic differed for each school. Of the 342 schools that had international student revenue in 2020 and 2021, 285 (83%) reported a reduced surplus or increased deficit from international student revenue. The largest reduction in international student revenue was more than $2 million.
3.18
The impact of border closures on schools in 2020 was not as significant as we expected because many of them retained their international students. The loss of international student revenue in 2020 was also mitigated by $20 million of Covid-19 transition funding for international education. In 2020, $18 million of that funding was allocated, leaving $2 million to be allocated in 2021.
3.19
The impact was more significant for schools in 2021 because borders were closed for the full year and there was significantly less Covid-19-related funding provided.
3.20
Because the borders only opened in early 2022, after the school term had started, we are yet to see how schools have been affected in 2022.
Overall financial results for 2021
3.21
Before 2020, schools reported a combined surplus of about $70 million each year. However, in 2020 schools reported a combined surplus of $220 million and in 2021 they reported a combined surplus of about $181 million. This increase is due to additional government grants being provided in 2020 and most of them continued into 2021. These grants were for the donation scheme (started in 2020), Covid-19, pay equity, and school lunches. For the schools that we have audited data for (1981), we have compared the number of schools that recorded a surplus and deficit with the previous year. We found that 67% of schools recorded a surplus in 2021, compared with 80% for 2020.
3.22
Figure 10 shows the aggregated surpluses and deficits for schools we have data for in 2021 and compares them to the 2019 and 2020 aggregated surpluses and deficits for schools.
Figure 10
Aggregated surpluses and deficits for schools in 2019, 2020, and 2021
Source: The Ministry of Education’s school financial information database.
Schools we consider to be in financial difficulty
3.23
Most schools are financially sound. However, each year we identify some schools that we consider could be in financial difficulty.
3.24
When we issue our audit report, we are required to consider whether the school can continue as a “going concern”. This means that the school has enough resources to operate for at least the next 12 months from the date of the audit report.
3.25
When carrying out our “going concern” assessment, we look for indicators of financial difficulty. One such indicator is when a school has a “working capital deficit”. This means that, at that point in time, the school needs to pay out more funds in the next 12 months than it has immediately available. Although a school will receive further funding in that period, it might find it difficult to pay bills as they fall due, depending on the timing of that funding.
3.26
A school that goes into overdraft or has low levels of available cash is another sign of potential financial difficulty. Because we are considering the 12 months after the audit report is signed, we will also consider the performance of the school and any relevant matters in the period since the year-end.
3.27
When considering the seriousness of the financial difficulty a school is in, we usually look at the size of its working capital deficit against its operations grant. Although many schools receive additional revenue, this is often through donations, fundraising, or other locally sourced revenue. Therefore, it is variable year-to-year. For most schools, the operations grant is their only consistent source of income.
3.28
Of the 34 schools with a working capital deficit this year:
- 22 (2020: 32) had a working capital deficit of between 0% and 10% of the operations grant;
- 7 (2020: 13) had a working capital deficit of between 10% and 20% of the operations grant; and
- 5 (2020: 8) had a working capital deficit of more than 20% of the operations grant.
3.29
Figure 11 shows that the decile rating for a school does not affect whether it has a working capital deficit. It also shows that the number of schools with a deficit significantly reduced since 2019 across all deciles.
Figure 11
Schools with working capital deficit, by decile
| Decile | 2021 | 2020 | 2019 |
|---|---|---|---|
| Decile 1 | 2 | 3 | 10 |
| Decile 2 | 2 | 4 | 14 |
| Decile 3 | 3 | 7 | 10 |
| Decile 4 | 4 | 3 | 6 |
| Decile 5 | 4 | 3 | 6 |
| Decile 6 | 3 | 9 | 13 |
| Decile 7 | 7 | 7 | 10 |
| Decile 8 | 5 | 7 | 13 |
| Decile 9 | 3 | 4 | 7 |
| Decile 10 | 1 | 6 | 11 |
| Total | 34 | 53 | 100 |
Source: The Ministry of Education’s school financial information database for 2021.
3.30
Of the five schools with a working capital deficit greater than 20% of its operations grant (which we consider to be serious financial difficulty), two are decile 7, two are decile 8, and one is decile 10.
Schools considered to be in serious financial difficulty
3.31
Not all schools with a working capital deficit at the balance date are considered to be in financial difficulty. When making this assessment, our auditors will consider other factors, including the financial performance since the year-end.
3.32
When we have assessed that a school is in financial difficulty, we ask the Ministry of Education whether it will continue to support it. If the Ministry confirms that it will continue to support the school, the school can complete its financial statements as a “going concern”.
3.33
If we consider a school to be in serious financial difficulty, we draw attention to this in the audit report.
3.34
Figure 12 lists 19 schools that received letters confirming the Ministry of Education’s support and, as a result, could complete their 2021 financial statements on a “going concern” basis. This is a slight increase from 2020, which had 17 schools with a letter confirming the Ministry’s support. However, it is still a reduction from previous years when the number of letters of support issued was about 40.
3.35
We referred to serious financial difficulties in eight of these 19 schools’ audit reports.
Figure 12
Schools that needed letters of support for their 2021 audits to confirm they were a “going concern”
| School | 2021 | 2020 | 2019* |
|---|---|---|---|
| Bathgate Park School | ✓ | ✓ | ✓ |
| Big Rock Primary School | ✓ | ✓ | ✓ |
| Burnside Primary School | ✓ | ✓ | ✓ |
| Cambridge East School | ✓ | ✓ | ✓ |
| Fraser High School | ✓ | ||
| Garston School | ✓ | ||
| Goldfields School (Cromwell) | ✓ | ||
| Halfway Bush School | ✓ | ||
| Kaikorai Valley College | ✓ | ||
| Kavanagh College† | ✓ | ✓ | ✓ |
| Koraunui School | ✓ | ||
| Liston College | ✓ | ✓ | ✓ |
| Matipo Road School | ✓ | ||
| Mercury Bay Area School | ✓ | ✓ | ✓ |
| Nelson College | ✓ | ✓ | ✓ |
| Northcote College | ✓ | ||
| Paparangi School | ✓ | ||
| Saint Joseph's School (Grey Lynn) | ✓ | ✓ | ✓ |
| Verran Primary School | ✓ | ||
| Total | 19 | 9 | 9 |
Source: Schools’ financial statements and the Office of the Auditor-General’s audit reports.
* In addition to 2019, some of the schools required letters of support in earlier years.
† Kavanagh College was renamed Trinity Catholic College from 1 January 2023.
3.36
We also identified the following schools that needed letters of support from the Ministry of Education from audits that were completed in 2021. These audits have been completed since we last reported:
- Laingholm School (2019 and 2020);
- Liston College (2019 and 2020);
- Massey High School (2019); and
- Te Kura Kaupapa Māori o Waiuku (2016 and 2017).
3.37
As well as the schools that needed a letter of support, our auditors raised concerns about potential financial difficulties with school boards in the management letters of an additional 40 schools. This was usually because of continued deficits that are eroding the working capital and/or continued deficit budgeting.
Planning to avoid financial difficulty
Equity Index
3.38
As at January 2023, the Equity Index will be used to determine the level of equity funding for a school instead of the decile system.
3.39
This has resulted in significant changes in funding for some schools. The Ministry of Education is providing transition funding for those schools that will lose funding. For 2023, no school will receive less operational funding than it did in 2022. From 2024, any reduction in funding will be capped at 5% each year of the operations grant of a school. Although there is transition funding in place, schools need to ensure that they are adjusting their budget to take into account the reduced funding levels.
Staffing levels
3.40
Each school is entitled to a certain number of full-time equivalent teachers that the Ministry of Education funds directly. The number of teachers is based on the size of the school roll. A school must pay for any teachers that are additional to the number of teachers it is entitled to. It can do this by paying the additional teachers directly from its own funds. The school can also pay back the Ministry any overuse of its entitlement of Ministry-funded teachers after the year end. Either can result in a reduction in the operational funding the school has to spend on other things.
3.41
All schools pay non-teaching staff from their operations grant. Schools can use their operations grant and other funding for additional teachers. If a school uses a large percentage of its operations grant to pay staff, it will need to find other sources to fund its other operational costs.
3.42
When schools are unable to generate the revenue they anticipated from other sources, they might have to spend cash reserves. If no other source is available, they might find themselves in financial difficulty.
3.43
When we calculated the board-funded staff costs as a percentage of the operations grant of each school for 2021, we found that the results were reasonably consistent with what we found in 2020 (see Figure 13). About 65% of schools have board-funded staff costs that are more than 60% of their operations grants. This is a significant portion of their operations grant.
Figure 13
Staff costs that are board-funded as a percentage of the school’s operations grants
| Year | 0-19% | 20-39% | 40-59% | 60-79% | 80-99% | 100%+ | Total number of schools |
|---|---|---|---|---|---|---|---|
| 2021 | 14 | 118 | 565 | 797 | 370 | 118 | 1981 |
| 2020 | 17 | 126 | 648 | 855 | 319 | 125 | 2090 |
Source: The Ministry of Education’s financial information database for 2021. Previous year figures are those reported in the Office of the Auditor-General’s Results of the 2020 school audits.
3.44
If schools continue to see a reduction in revenue from local sources, they should consider their overall budget, including their staffing levels, to help prevent them getting into financial difficulty.
4: Ministry of Education (2021), Ngā Ara o te Mātauranga: The pathways of education – incorporating Ngā Kura o Aotearoa: New Zealand Schools, at educationcounts.govt.nz and the Ministry of Education’s school financial information database.
