Part 7: Institutes of technology and polytechnics’ financial results and enrolment
Main financial results
7.1
In our report on the results of the 2017 TEI audits, we focused mostly on the ITPs’ financial performance.
7.2
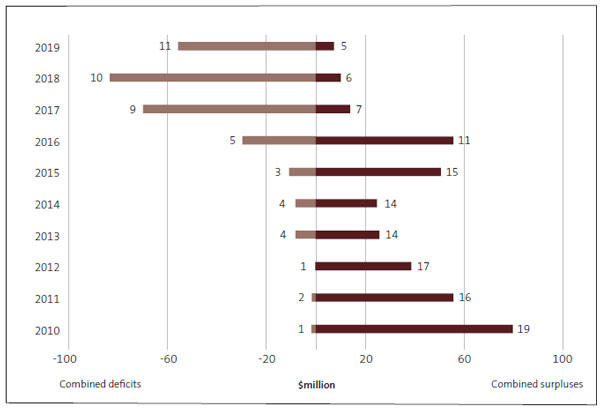
In that report, we noted that, from 2016 to 2017, the number of ITPs in financial difficulty and the ITPs’ combined deficit had both significantly increased. In 2018, 10 ITPs incurred a deficit, and the combined deficit increased to $83.4 million.
7.3
In 2019, the Universal College of Learning incurred a deficit of $1.2 million, after incurring a surplus of $1.08 million in 2018. Figure 10 shows that 11 ITPs incurred a combined deficit of $55.8 million in 2019. However, the combined deficit was $27.6 million less than the 2018 combined deficit of $83.4 million.
7.4
In 2019, five ITPs had a combined surplus of $7.4 million. In 2018, six ITPs had a combined surplus of $10.1 million.
7.5
We added the deficits and surpluses for ITPs together. The overall deficit for ITPs decreased to $48.5 million, from a $73.3 million deficit in 2018. We understand that Te Pūkenga’s July 2020 forecasts show the deficit increasing to $53 million in 2020.
Figure 10
Institutes of technology and polytechnics’ combined surpluses and deficits, from 2010 to 2019

Note: The numbers at the end of each bar indicate the number of TEIs making up the combined surpluses and deficits for those years.
Source: Office of the Auditor-General.
Individual surpluses and deficits in 201
7.6
The Tertiary Education Commission has a framework for monitoring the financial viability of TEIs. It sets risk thresholds for each of the measures in the framework. One measure the Tertiary Education Commission uses is surplus as a percentage of revenue. The low-risk threshold (that is, performing as, or better than, expected) is 3% or more
7.7
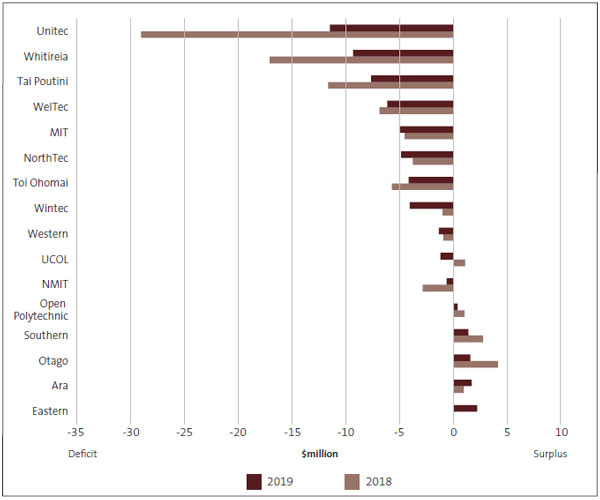
Of the five ITPs making a surplus, only Eastern Institute of Technology made a return of 3% of revenue or more. Its surplus increased by about $2.2 million in 2019
7.8
Figure 11 shows that Unitec Institute of Technology, Whitireia, Tai Poutini Polytechnic, WelTec, Toi Ohomai Institute of Technology, and Nelson Marlborough Institute of Technology reduced their deficits in 2019. Manukau Institute of Technology, Northland Polytechnic, Wintec, and Western Institute of Technology at Taranaki all incurred greater deficits in 2019.
Figure 11
Surpluses and deficits for each institute of technology and polytechnic, 2018 and 2019

Note: Eastern Institute of Technology’s 2018 surplus was $68,000. This does not register on the scale, which is in $millions.
Source: Office of the Auditor-General.
7.9
The Government had to provide balance sheet support to Unitec Institute of Technology (a loan). It also provided support to Whitireia and Tai Poutini Polytechnic (capital injections). This support enabled the three TEIs to meet their current liabilities.
7.10
As with last year, the main reason that revenue did not meet forecasts was a continued decline in the number of EFTS enrolments.
Enrolments
7.11
Figure 12 shows that, overall, student enrolment numbers for ITPs continued to decline in 2019. Total domestic EFTS enrolments decreased from 61,079 in 2018 to 58,268 in 2019, and international EFTS enrolments decreased from 11,661 in 2018 to 10,715 in 2019. International EFTS enrolments are about 15.5% of student enrolments.
Figure 12
Total full-time student enrolments in EFTS and the percentage of international EFTS at institutes of technology and polytechnics, from 2017 to 2019

Source: Data collected from ITPs’ annual reports.
Domestic student enrolment
7.12
ITPs were not equally affected by the continued decline in EFTS enrolments. Figure 13 shows that Unitec Institute of Technology had the largest decrease in domestic EFTS, with 1205 fewer domestic EFTS than in 2018. Tai Poutini Polytechnic and Toi Ohomai Institute of Technology had 482 and 451 fewer domestic EFTS, respectively.
Figure 13
Domestic equivalent full-time student enrolments at institutes of technology and polytechnics, from 2017 to 2019

Source: Data collected from ITPs’ annual reports.
7.13
The Open Polytechnic had the largest increase in domestic enrolments, with 492. Ara Institute of Canterbury and the Eastern Institute of Technology had small increases in domestic EFTS enrolments.
International student enrolments
7.14
Figure 14 shows that the ITPs with the most decreases in international EFTS enrolments were Unitec Institute of Technology (536) and Otago Polytechnic (278). The ITPs with the most increases in international EFTS were Toi Ohomai Institute of Technology (164), Western Institute of Technology at Taranaki (129), and Ara Institute of Canterbury (126). Overall, international enrolments in EFTS were down by slightly more than 8% (946) compared to 2018.
Assets, liabilities, and equity
7.15
If Te Pūkenga had been established at 31 December 2019, it would have had total group assets of $2.62 billion (2018: $2.57 billion), total liabilities of $481 million (2018: $452 million), and $2.14 billion in equity. It would have had enough cash to pay its bills as they fell due.35 However, results for the subsidiary companies varied considerably.
7.16
Six ITPs had lower asset values in 2019 than in 2017. This is mostly a result of the ITPs downsizing their operations in response to fewer enrolments by disposing of assets, such as land and property.
7.17
Tai Poutini Polytechnic had the most significant reduction in the value of assets (37% less), followed by Unitec Institute of Technology (26% less) and Manukau Institute of Technology (14% less). Southern Institute of Technology increased its asset base by 20% during the same period.
7.18
Manukau Institute of Technology and Unitec Institute of Technology used the proceeds of asset sales to repay borrowing, which significantly reduced their liabilities. Tai Poutini Polytechnic’s liabilities increased.
7.19
Eight of the ITPs had current ratios below 1. That means that they had less in cash and cash equivalents than their short-term liabilities.
7.20
Otago Polytechnic had the lowest ratio at 0.23, followed by Whitireia at 0.38 and Wintec at 0.67. A low current ratio does not imply going concern issues if the ITP can raise cash or access borrowing quickly, but these three ITPs were also close to their current borrowing limits in 2019.
Figure 14
International equivalent full-time student enrolments at institutes of technology and polytechnics, from 2017 to 2019

Source: Data collected from ITPs’ annual reports.
7.21
A capital injection in late 2019 improved Tai Poutini Polytechnic’s 2019 and 2020 position, but its position is forecast to deteriorate in 2021.
7.22
The total equity held by all 16 ITPs was $2.14 billion. This represents all of the assets held by the ITPs, less all of their liabilities. Tai Poutini Polytechnic has the lowest level of net equity at $11.8 million, less than half of Western Institute of Technology at Taranaki, which has the next lowest at slightly less than $28 million.
Conclusion
7.23
Only four ITPs (Ara Institute of Canterbury, Eastern Institute of Technology, Southern Institute of Technology, and the Open Polytechnic) ended 2019 having achieved a break-even result or better as well as having a current ratio of more than 1.
7.24
Te Pūkenga will be able to take a group approach to financial management. However, there are indicators that most, if not all, metrics will get worse in 2020.
7.25
Revenue from international students is down, and some underlying cost issues still need to be addressed. This means that increased 2020 domestic enrolments evident at many subsidiaries might not lead to better overall financial results.
35: Its current ratio would have been 1.17. In practice, a ring-fencing policy limits how much cash can be moved around the group in the future, because some can only be used locally.

