Part 5: Universities’ financial results and enrolments
5.1
In our briefing to the Education and Workforce Committee on the results of the 2018 TEI audits last year, we concluded that all universities were in good financial standing and had low debt and strong equity. We said:
[A]lthough future international student enrolment patterns might be more volatile than in the past, we considered universities had enough resources to manage any period of adjustment.
5.2
Covid-19 was a “non-adjusting subsequent event”, which means that the figures reported in the December 2019 financial statements did not need to change. In this report, we have revisited our financial analysis from last year to see whether, and by how much, the financial position of universities had changed.
Main financial results
5.3
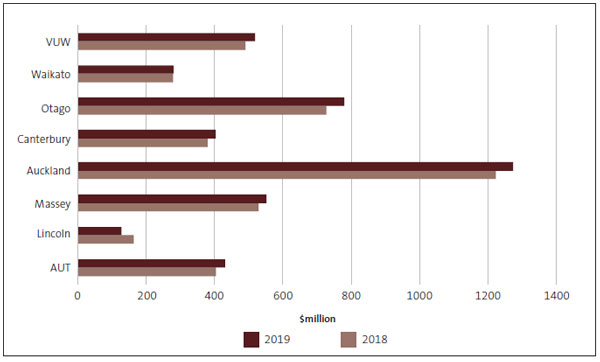
Figure 1 shows that every university except Lincoln University earned more revenue in 2019 than in 2018. Lincoln University’s revenue for 2018 reflected a one-off insurance payment for earthquake damage. Six of the other seven universities had increases in revenue of between 4.1% and 7.1%. The University of Waikato’s increase looks minimal, but it had a significant one-off capital donation in 2018. Its performance on a like-for-like basis shows a much more positive result for 2019.
Figure 1
Revenue for universities, 2018 and 2019
Source: Office of the Auditor-General.
5.4
All of the universities achieved a surplus, but four made less in 2019 than in 2018. Figure 2 shows that the University of Waikato, Massey University, and Lincoln University’s surpluses all decreased from 2018. Auckland University of Technology’s surplus also had a small decrease.
Figure 2
Total university surpluses, 2018 and 2019

Note: Lincoln University’s 2019 surplus was $172,000. This barely registers on the scale in the graph, which is in $millions.
Source: Office of the Auditor-General.
5.5
Figure 3 shows that all universities had positive operating cash flows and that five generated larger cash flows in 2019 than in 2018. Although the University of Waikato’s operating cash flow was positive, its net cash flow decreased from about $74 million to less than $29 million. This also reflected the one-off donation in 2018. For all universities, operating cash flows increased by slightly more than $112 million.
Figure 3
University cash flows from operations, 2018 and 2019

Source: Office of the Auditor-General.
5.6
Debt is still low in relation to assets. Only three universities have a debt-to-asset ratio of more than 1%, and the other five have no debt. Auckland University of Technology’s debt ratio reduced from 15% to 11% in 2019, and Victoria University of Wellington’s reduced from 9% to 6%. Only Auckland’s debt ratio increased, from 1% to 4%.
5.7
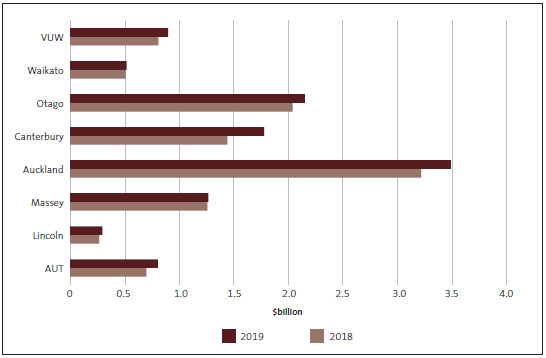
All universities still have strong balance sheets. Figure 4 shows that all universities had more equity in 2019 than in 2018. Total equity increased by $960 million to slightly more than $12 billion.
Figure 4
University equity, 2018 and 2019
Source: Office of the Auditor-General.
5.8
Some universities have historically operated with low current ratios – that is, their current liabilities exceeded their cash or cash equivalents. However, in these uncertain times, higher current ratios would be prudent because of the effects of Covid-19 on revenue flows.
5.9
Current ratios are only one measure of liquidity. Because of the overall financial standing of universities, the low current ratios are not concerning.
5.10
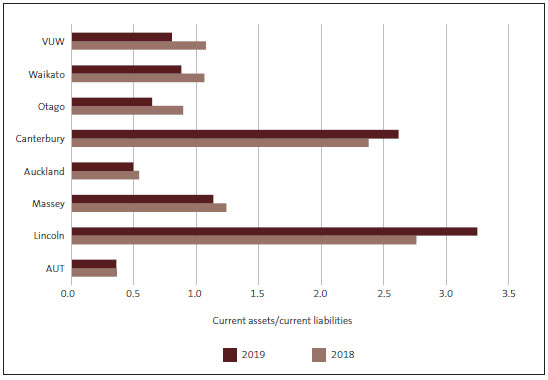
Figure 5 shows that five universities had current ratios of less than 1 in 2019 and that six had lower current ratios in 2019 than in 2018.
Figure 5
University current ratios, 2018 and 2019
Source: Office of the Auditor-General.
Enrolments
5.11
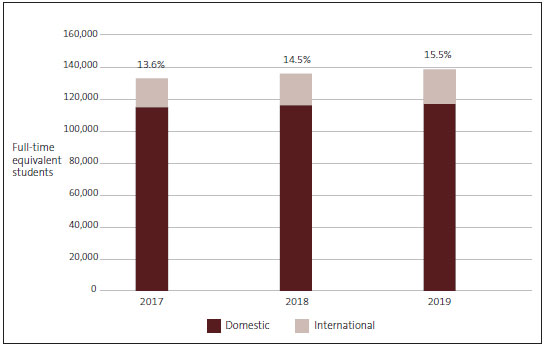
Figure 6 shows that the total number of equivalent full-time students (EFTS) enrolled at universities increased from 136,044 in 2018 to 138,805 in 2019. Both domestic and international EFTS enrolments increased.
5.12
Because international enrolments are increasing at a greater rate than domestic enrolments, they now account for a higher percentage of all enrolments. This is opposite to enrolments at ITPs.
Figure 6
Total full-time student enrolments in EFTS and the percentage of international EFTS at universities, from 2017 to 2019
Source: Data collected from universities’ annual reports.
5.13
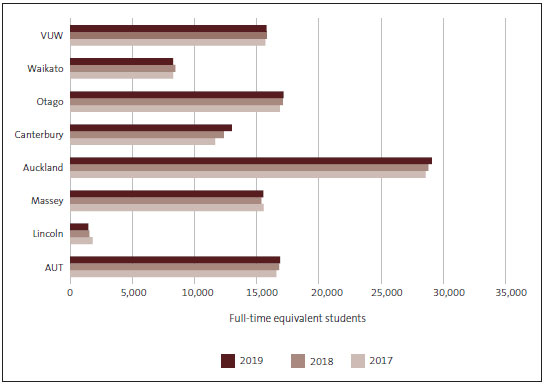
Most universities had an increase in domestic enrolments. Figure 7 shows that University of Canterbury continued to have the highest increase in enrolments (highest numbers and highest percentage). This reflects its recovery strategy from the 2010 and 2011 Canterbury earthquakes.
5.14
Lincoln University’s domestic enrolments decreased for the third year in a row. This is because it no longer operates a campus at Telford. The University of Waikato’s enrolments had increased in 2018 but are now back at a similar level to 2016 and 2017.
Figure 7
Domestic equivalent full-time student enrolments at universities, from 2017 to 2019
Source: Data collected from universities’ annual reports.
5.15
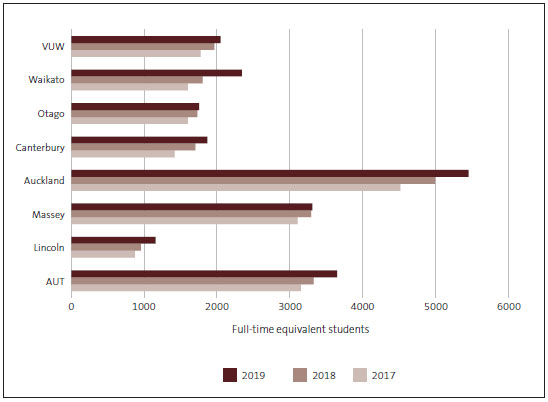
Figure 8 shows that every university had an increase in international EFTS enrolments in 2019. However, Massey University and the University of Otago had small increases. Otago has a policy that international enrolments will not be more than 15% of total enrolments and that no more than 25% of international students will come from a single country.
Figure 8
International equivalent full-time student enrolments at universities, from 2017 to 2019
Source: Data collected from universities’ annual reports.
Conclusion
5.16
Universities generally ended 2019 in an improved financial position from 2018.

