Financial and enrolment results at a glance
Tertiary education institutions: 2019 audit results and what we saw in 2020.
| Total revenue | Total assets | |
| $5.6 billion up $200 million from 2018. |
$16.3 billion up $1.6 billion from 2018. |
|
| Surpluses and deficits | Total liabilities | |
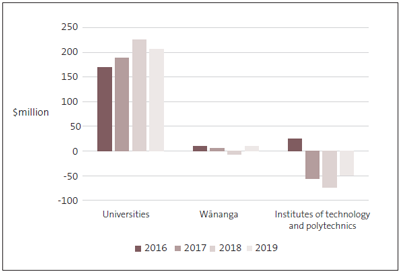
 All universities and wānanga ended the year with surpluses, but 11 out of the 16 ITPs made a combined loss of $55.8 million (2018:10 ITPs/$82.5 million loss) All universities and wānanga ended the year with surpluses, but 11 out of the 16 ITPs made a combined loss of $55.8 million (2018:10 ITPs/$82.5 million loss) |
$2.6 billion up $240 million from 2018. |
|
| Group surpluses and deficits, by type of tertiary education institution, 2016 to 2019 |  |
|
| Equivalent full-time students | ||
 |
229,974 (2018: 232,274) |
Overall, universities saw increases in domestic and international students, but numbers fell at other TEIs. 32,302 of the total were international equivalent full-time students (2018: 31,489). |
| Equivalent full-time students (EFTS) | ||
| Universities | Wānanga | Institutes of technology and polytechnics |
 |
 |
 |
| 138,805 EFTS (2018: 136,044) Including 21,572 international EFTS (15.5%) |
22,186 EFTS (2018:23,490) Including 15 international EFTS |
68,983 EFTS (2018: 72,740) Including 10,715 international EFTS (15.5%) |

