Part 3: Our performance story
In this Part, we report against the outcomes we contribute towards, and describe our performance against our intended impacts, and the services that we are funded to deliver. Collectively, these describe our performance story in 2019/20.
Reporting against the outcomes we contribute towards
The outcomes we seek and our intended impacts are shown in the highlighted layers of our performance framework in the image below.
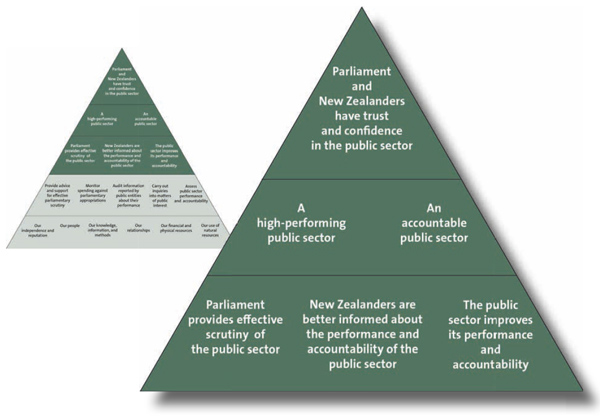
Overall progress against our outcome indicators was mostly maintained or improved in 2019/20. Considering the effects on the current operating environment from the Covid-19 pandemic response and recovery efforts, it is even more important that public organisations continue to improve how they account for the public resources they use, meet the high standards of governance and integrity expected, and improve their performance. We will continue to play our part in influencing these important outcomes.
Outcome 1: Parliament and New Zealanders have trust and confidence in the public sector
Trust and confidence are the foundations of our system of government. They are fundamental to giving the Government the ability to govern on behalf of the people. To earn New Zealanders' trust and confidence, the public sector must be competent and reliable and act with integrity.
| Our indicators | Progress | |||
|---|---|---|---|---|
| Levels of trust in public services (Kiwis Count survey) |
Experience-based trust |  |
||
| Perception-based trust |  |
|||
| Overall, New Zealanders' levels of trust, based on their personal experience and on their perception of the public service brand, have improved over time. However, there are statistically significant lower results for Māori. For example, trust based on experience was 79% overall in 2019 (80% in 2018), but 65% for Māori (70% in 2018). For perception-based trust, the 2019 overall result was 49% but it was 40% for Māori (35% in 2018). Source: Te Kawa Mataaho Public Service Commission. |
||||
| Corruption perception score (Transparency International Corruption Perceptions Index) |
2019 | 2018 | 2017 | |
| 87 | 87 | 89 | ||
| 1st equal | 2nd | 1st | ||
| With a score of 87 out of 100, the most recent results show that New Zealand's public sector ranked first equal with Denmark as the least corrupt countries in the world (out of a total of 180 countries and territories assessed). By maintaining its 2018 score, New Zealand remains one of the top-performing countries in the Index. Source: Transparency International. |
||||
Outcome 2: A high-performing public sector
A high-performing public sector is one that delivers, has strong leadership, builds institutional capacity and capability, and is transparent. It has a public management system that supports and enables it to do this.
| Our indicators | Progress |
|---|---|
| Quality of public services (Kiwis Count survey) |
 |
| Since 2007, a sample of New Zealanders has been surveyed to measure satisfaction with a wide cross-section of public services through the Kiwis Count survey. New Zealanders hold public services in reasonably high regard, and there has been steady improvement in the satisfaction trends since 2007. The average overall service quality score for 2019 is 77 (out of 100) across the 43 services measured. | |
Outcome 3: An accountable public sector
Accountability for the use of public resources is critical. For Parliament and New Zealanders to have trust and confidence in the public sector, public organisations need to provide reliable, meaningful, and timely information so that they can be held accountable.
Each year, we assess trends for these aspects of public sector accountability, including timely and reliable information, sound management, and good governance. To assess whether the public sector demonstrates accountability for its performance, including its use of public resources, we examine the relevance, reliability, and timeliness of annual reports (including financial and performance reports).
We show a high-level summary of the results across our indicators below. While the relevance and reliability of information is maintained, the Covid-19 pandemic has significantly affected the ability of some public organisations to provide the financial information required for us to complete our audits and issue our audit reports and opinions by the applicable statutory deadlines.
The first three indicators shown in the following table are extracted from the information provided later in this Part under the heading "3. Audit information reported by public entities about their performance". Together, they provide an indication of public sector quality and timeliness.
| Our indicators | Progress | ||
|---|---|---|---|
| Number and percentage of unmodified audit opinions from our annual audits |  |
||
| Percentage of audit reports and opinions that are signed-off by the applicable statutory deadline* |  |
||
| Percentage of entities with audit opinions in arrears as at 30 June* | 2019/20 25% |
2018/19 New measure for 2019/20 |
2017/18 New measure for 2019/20 |
| * The Covid-19 pandemic has had a significant adverse effect on our timeliness of completing audits (particularly audits of schools, as they are required to present their reports to us by 31 March, and we are required to audit them by 31 May each year). More information about this is provided later in this Part under the heading "3. Audit information reported by public entities about their performance". | |||
| Worldwide governance ranking (Worldwide Governance Indicators) | 2018 | 2017 | 2016 |
| Above 90th percentile | Above 90th percentile | Above 90th percentile | |
| New Zealand has consistently ranked above the 90th percentile for all six dimensions of the World Bank's Worldwide Governance Indicators over the last three years. The results for 2019 are not yet available. Source: World Bank. |
|||
| Integrity ranking (International Civil Service Effectiveness Index) |
2020 | 2019 | 2018 |
| Not assessed | 1st | Not comparable | |
| The most recent results from the University of Oxford's 2019 International Civil Service Effectiveness Index show that the New Zealand public sector ranked first on integrity against a total of 38 countries assessed. Source: University of Oxford. |
|||
Reporting against our intended impacts
Our impact indicators demonstrate the immediate impact or direct effect we are making on our key stakeholders (that is Parliament, New Zealanders, and public organisations).
Overall, the results from our impact indicators tell us that we are achieving the impacts we set out to make. Select committees consider that our advice and reports help them to effectively scrutinise the public sector, our work is increasingly receiving more media coverage (about 13 percent more than in the previous financial year), and our recommendations help public organisations to improve their performance.
The results also reflect that the instances of public spending without Parliamentary authority continue to reduce (see results under Impact 3 on the following page, and the graph on page 24), and that public organisations are fairly presenting their financial statements and service performance reports.
Impact 1: Parliament provides effective scrutiny of the public sector
| Indicator | Target | 2019/20 result |
2018/19 result |
2017/18 result |
|---|---|---|---|---|
| Our advice and reports help select committees scrutinise the public sector more effectively. Parliamentary select committees confirm our advice and reports were helpful. |
100% | 100% | New indicator for 2019/20 | New indicator for 2019/20 |
Impact 2: New Zealanders are better informed about the performance and accountability of the public sector
| Indicator | Target | 2019/20 result |
2018/19 result |
2017/18 result |
|---|---|---|---|---|
| New Zealand media provide increased coverage of our reports and letters. Number of citations. |
Increasing | Increasing 1454 |
Decreasing 1277 |
Establishing baseline data 1667 |
Impact 3: The public sector improves its performance and accountability
| Indicator | Target | 2019/20 result |
2018/19 result |
2017/18 result |
|---|---|---|---|---|
| Public entities have improved aspects of their performance in response to our performance audits. We will identify and report on whether entities implemented recommendations from our performance audits, and if they have had the intended effect. |
Increasing | Results not available | Achieved | Achieved |
| Delays with recruitment for key positions, and the effects of the Covid-19 pandemic on our workforce, have affected our ability to complete our planned follow-up reporting. Of the two planned follow-up reports, one was published in August 2020, which showed that the entity had made progress against our recommendations. We expect the other report to be published by the end of October 2020. | ||||
| Public entities have improved aspects of their performance in response to our inquiries. We will identify and report on any effects from our inquiries. |
Report on one to two per year | Achieved | Achieved | Achieved |
| Further information is provided in this Part under the heading "4. Carry out inquiries into matters of public interest on the impact of our inquiries work". | ||||
| Government departments reduce the instances of public spending without Parliamentary authority. Number of instances of expenditure incurred in excess of, or without, appropriation or other authority from Parliament. |
Reducing | Reducing 14 |
Increasing 21 |
Increasing 18 |
| The results for this indicator are extracted from the Financial Statements of the Government (FSG) which are prepared for the previous financial year. The 2019/20 result for this indicator is based on information from the 2018/19 FSG, and the 2018/19 result is based on information from the 2017/18 FSG. | ||||
| Public entities implement our annual audit recommendations in a timely manner. We will identify and report on how larger entities have responded to recommendations made as part of our annual audits. |
Increasing (or maintaining) | 46% Baseline data yet to be established |
New indicator for 2019/20 | New indicator for 2019/20 |
| Due to the timing of when this new impact indicator was implemented, we were only able to obtain data relating to 24 tertiary education institutions. For these 24 institutions, there were 350 open recommendations at the end of the audit carried out during the first half of 2019. Of these 350 recommendations, 161 were implemented by the end of the next audit carried out during the first half of 2020. Of the recommendations yet to be implemented, seven are categorised as high risk. All other high-risk recommendations were implemented between the 2019 and 2020 audits. Our expectation is that larger entities (which include district health boards, tertiary education institutions, government departments, and councils) will adopt many of the outstanding recommendations over time to continually improve. For the year ending 30 June 2021, we expect to be able to report on all of the larger entities within our mandate (about 210). |
||||
Reporting against our services
The services that we are funded to deliver are described in the highlighted layer of our performance framework as shown below.
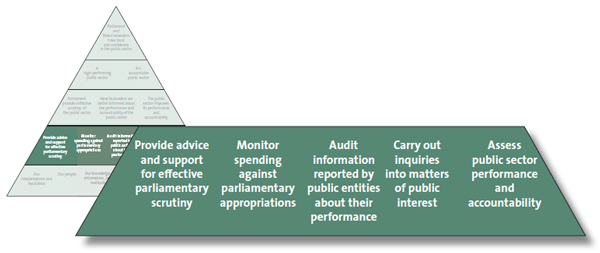
1. Provide advice and support for effective parliamentary scrutiny
This service is funded through the appropriation Statutory Auditor Function MCA.
 Each year, we publish reports on the results of our annual audits, performance audits, major inquiries and other work. The information we gather gives us a unique view of the challenges, emerging issues and trends across the public sector.
Drawing on the insights we gain about how the public sector operates, we provide advice and support to Parliament and select committees, including through annual reviews of public organisations and the Estimates of Appropriations examinations after the Government announces its Budget each year.
We also carry out and report on our responsibility under the Local Government (Auckland Council) Act 2009 to review the service performance of Auckland Council and its subsidiaries.
Performance for Provide advice and support for effective parliamentary scrutiny
| Performance measure | Performance standard | 2019/20 result |
2018/19 result |
2017/18 result |
|---|---|---|---|---|
| Percentage of Parliamentary select committees that rate our advice as at least "satisfactory". | 100% | 100% | Revised measure for 2019/20* | Revised measure for 2019/20* |
| * This measure was revised for 2019/20 due to it now being based on collecting information only from select committees. It was previously "Stakeholders we survey confirm that our advice assists them". The measure previously covered feedback from both select committees and public sector leaders. We reported the result for this measure in both 2018/19 and 2017/18 as 77%, drawing on a biennial survey carried out in 2018. | ||||
| Percentage of briefing papers that are submitted to select committees by the agreed deadline. | 100% | 98% | 100% | 100% |
| The wording of this measure was revised for the 2019/20 year. It was previously "Briefings are given to select committees at least two days before examination, unless otherwise agreed". However, the measure has remained substantially the same. | ||||
Our work to support Parliament
Demand from select committees for our advice has remained high. In 2019/20, select committees asked us to provide 99 briefings in support of annual reviews and 64 briefings for Estimates of Appropriation examinations. In addition, we provided six sector briefings, and initiated a different approach by inviting members of Parliament to briefings about our recent reports on three occasions. We also produced a "reflections" report on water management after completing a substantial work programme over a two-year period.
Feedback from select committee chairpersons remains positive. Our briefings and their contribution to supporting Parliament in its scrutiny of the public sector continue to be valued. We commit significant resources to building our knowledge of the public sector and to scanning for emerging trends and risks. We draw on our knowledge to tailor our briefings to select committees according to the significance of the public organisations and the issues and risks they face.
This year, we started to reshape how we organise our staff resources in both the central and local government sector teams. Our objective is to better reflect the increased emphasis on cross-agency work in the public sector, and to meet the corresponding increased demand from select committees for reviews of proposed spending and activities across different votes as part of our Estimates briefings. Examples of where we have provided information across different votes include our support for select committee hearings related to the Provincial Growth Fund and for the Joint Venture on Family and Sexual Violence.
At the same time, we want to ensure that we retain the ability to respond as needed to new or rapidly emerging issues – for example, our reporting on the Ministry of Health's management of personal protective equipment in response to the Covid-19 pandemic and on the Police's implementation of the firearms buy-back and amnesty scheme, as described in the cross-Office highlights on pages 36-37. We try to maximise the different skill sets and knowledge of our staff across the Office.
2. Monitor spending against parliamentary appropriations (our Controller function)
This service is funded through the appropriation Statutory Auditor Function MCA.
 Our Controller function provides independent assurance to Parliament that public money has been spent lawfully and within Parliamentary authority. It supports the important constitutional principle that the Government cannot spend, borrow, or impose a tax without Parliament's approval.
In conjunction with our annual audits, we carry out appropriation audits of government departments. Appropriation audits are designed to ensure that spending by government departments and Offices of Parliament is lawful and within the scope, amount, and period of the appropriation or other authority.
In addition to the appropriation audits, we carry out procedures for the Controller function in keeping with a Memorandum of Understanding with the Treasury. Throughout the year, we examine financial information and reports that the Treasury provides. We discuss any issues with the Treasury and advise government departments and the Treasury on any action that needs to be taken. We report our findings and conclusions to the Treasury throughout the year (by monthly Controller reports), and we also report periodically to Parliament and the public.
Performance for Monitor spending against parliamentary appropriations
| Performance measure | Performance standard | 2019/20 result | 2018/19 result | 2017/18 result |
|---|---|---|---|---|
| The monthly Controller reports are provided to the Treasury within 5 working days of receiving the Treasury's monthly reports and statements (for September to June). | All nine reports | All procedures were followed and agreed time frames were met for all nine reports | All procedures were followed and agreed time frames were met | All procedures were followed and agreed time frames were met |
| The nine reports cover the period from July to September and then each month to May. They are provided monthly from October to June. | ||||
| We issue a report to Parliament and the public on the Auditor-General's exercise of the Controller function for each financial year. | At least annually | We issued six public reports on the Controller function | New measure for 2019/20 | New measure for 2019/20 |
Our Controller work
Every year, we present a report to Parliament that includes an account of the work we carried out under the Controller function, along with our findings and conclusions. In recent years, we have also been reporting publicly on our work for each six-month period. These reports provide interim accounts of our work and findings.
In response to the Covid-19 pandemic, and in addition to our usual six-monthly reports, we have been reporting monthly on the Government's Covid-19 expenditure. We have been tracking the amount of public money that the Government has approved for the response to, and recovery from, the Covid-19 pandemic as well as the actual expenditure incurred. We carried out tests to determine whether the Covid-19 expenditure approvals were properly authorised and that subsequent expenditure has been incurred in line with those approvals.
Understanding the impact of our work
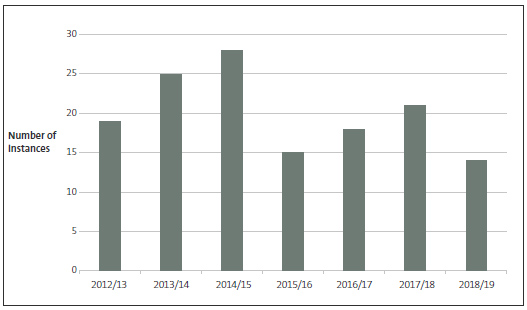
One of the impacts we seek is that government departments reduce the instances of public spending without appropriation or other Parliamentary authority. In the last seven years, there has been a general decline in the number of instances of unappropriated expenditure, as reported in the Financial Statements of the Government of New Zealand.
The graph shows the number of reported instances of unappropriated expenditure each year, from 2012/13 to 2018/19. The number of instances increased from 2012/13 to 2014/15. Since then, there have been fewer instances of unappropriated expenditure. In 2018/19, there were 14 instances of unappropriated expenditure, amounting to $205 million. This equates to 0.2% of the expenditure budgeted for 2018/19 in Budget 2018.
Unappropriated expenditure from 2012/13 to 2018/19
We have seen several instances over the last two years of unappropriated expenditure that could have been avoided with more careful management. Some expenditure was unappropriated because departments that were anticipating funding transfers from the previous year incurred expenditure prematurely – that is, before the authority had been confirmed. We have reminded departments to take care in managing the timing of any expenditure that relies on increased authority, including potential funding transfers between years. We have also been encouraging departments to try to anticipate when costs might be higher than expected and seek additional authority for that in advance. In some other instances, unappropriated expenditure can be caused by events outside a department's control or by an event that has no effect on actual expenditure (for example, when a funding recipient named in the appropriation changes their name and so is no longer covered by the appropriation authority).
3. Audit information reported by public entities about their performance
This service is funded through the appropriations Audit and Assurance Services RDA and Audit and Assurance Services.
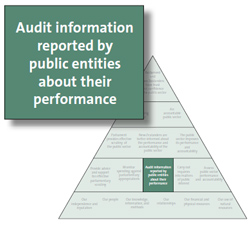 Annual audits of public entities are core work for our Office, accounting for nearly 85% of our resources. We also issue reports to those charged with governance on how the public entities' control environment, performance, and reporting could be improved. Our annual audits fundamentally support the integrity of the financial and performance reporting of public entities. All our work is built on this very solid foundation.
Our audit work is carried out by either the Auditor-General's in-house audit service provider, Audit New Zealand, or private sector audit service providers.
Our audit work is funded by fees charged to each audited public entity, which are agreed after consultation with the entity. This also creates some constructive tension to ensure that audit fees are reasonable, in that they are fair to the entity and also provide a fair return to the auditor.
Other assurance work
Audit New Zealand also carries out other assurance work. This work is generally focused on reviewing procurement and contract management, project management, asset management, risk management, governance, and conflicts of interest, but can include any services of a kind that it is reasonable and appropriate for an auditor to perform.
Assurance is typically provided to senior managers and governors. By extension, such assurance work supports stakeholder's trust and confidence in public entities. It promotes value by helping public entities to ensure compliance with rules and guidelines and adopt good practice. Audit New Zealand and our other audit service providers also undertake other assurance engagements that are prescribed in legislation other than the Public Audit Act 2001.
These assurance engagements include (for example) work undertaken to support disclosure regimes required by the Commerce Commission.
The Auditor-General's Auditing Standards
The Public Audit Act 2001 requires us to report each year on any significant changes made to The Auditor-General's Auditing Standards. This year, we reviewed the standards and published The Auditor-General's Auditing Standards 2020 (as we are required to do at least every three years). While there were no significant changes made to most of the standards, we further strengthened the Auditor-General's standard on independence by limiting the work that audit service providers can carry out in addition to the audit of public entities, to work of an assurance nature. This came into effect from 1 April 2020. In addition, we now require our audit service providers to specifically examine the expenditure of the chairperson and chief executive of each public entity annually, and to examine the expenditure of other members of key management personnel on a rotation basis. This is to better reflect that integrity and ethics underpin trust and confidence in our system of public management.
Performance for Audit information reported by public entities about their performance
| Performance measure | Performance standard | 2019/20 result |
2018/19 result |
2017/18 result |
|---|---|---|---|---|
| Number of annual audit reports signed and issued. | Not applicable | 2922 | New measure for 2019/20 | New measure for 2019/20 |
| In a normal year, we would expect to sign and issue approximately 3400 audit reports. The Covid-19 pandemic significantly affected the number of audit reports we signed and issued in 2019/20. The timely completion of school audits was particularly affected (schools are required to present their reports to us by 31 March, and we are required to audit them by 31 May each year), and many of these audits were not complete at 30 June 2020. We expect to progressively complete them over the next few months. | ||||
| Number of council long-term plan (LTP) audit reports signed and issued. | Not applicable | Not assessed, as not an LTP year | Not assessed, as not an LTP year | 100% |
| Annual independent review confirms the probity and objectivity of the methods and processes we use to allocate and tender audits and to monitor the reasonableness of audit fees. | Confirmed | Confirmed by annual independent review (See Appendix 2) |
Confirmed by annual independent review | Confirmed by annual independent review |
| Quality | ||||
| Percentage of audit files subject to quality assurance review during the year that achieve a rating of at least "satisfactory". | 100% | 91% | New measure for 2019/20 | New measure for 2019/20 |
| As part of our quality assurance reviews of appointed auditors, we review a sample of audit files, which informs our overall rating. This year, 91% of the audit files we reviewed achieved a rating of at least "satisfactory". For those audit files that did not meet a "satisfactory" rating, we determined what remediation was necessary. For these audits, we assessed that our findings would not have a material effect on the audit opinion issued. | ||||
| Percentage of appointed auditors with a quality assurance grade of at least "satisfactory", based on the most recent quality assurance review. | 100% | 93% | 94% | 95% |
| For the 7% of appointed auditors who were not graded as "at least satisfactory", improvements are required to the audit approach or audit evidence obtained. In those cases, the reviewer was satisfied that there was no reason to withdraw the audit report. The reviewer concluded that a follow-up review should be carried out during 2020/21 to assess the improvements made. | ||||
| Number of audit reports withdrawn. | No audit reports withdrawn | 4 | New measure for 2019/20 | New measure for 2019/20 |
The reasons for the four audit reports being withdrawn were:
|
||||
| Percentage of public entities that are "satisfied" with the overall quality of their audit service (as determined by responses to our satisfaction survey). | At least 85% | 82% | 76% | 80% |
| Percentage of Ministers who rate our Ministerial letters (reports to them on our annual audits) as at least satisfactory. | At least 85% | See explanation below | New measure for 2019/20 | New measure for 2019/20 |
| We report to ministers on the findings from our annual audits of central government entities. In 2019/20, we issued 184 reports to ministers. We prepared a survey of ministers to obtain the data required for this measure. However, due to the Covid-19 pandemic, we put the survey on hold until June 2020. We sent the survey out in June 2020 to 22 ministers and received responses from four. Of the four responses, three rated our letters as at least satisfactory and one rated our letters as neutral, resulting in a 75% overall result. However, due to this being a small sample size, the validity of the results is limited for reporting purposes. |
||||
| Timeliness | ||||
| Percentage of audit reports and opinions that are signed by the applicable statutory deadline. | At least 80% | 63% | 81% | 83% |
| School audits have a statutory deadline of 31 May. Due to the Covid-19 pandemic, 59% of schools, and a small number of public entities such as subsidiaries of public entities, were not able to provide the financial information required for us to complete our audits and issue our audit reports and opinions by the applicable statutory deadline. | ||||
| Percentage of entities with audit opinions in arrears as at 30 June. | Less than 10% | 25% | New measure for 2019/20 | New measure for 2019/20 |
| An audit opinion is in arrears when the audit opinion has not been signed and the statutory reporting deadline has passed. The Covid-19 pandemic has adversely affected the percentage of entities with audit opinions in arrears at 30 June. This relates mainly to school audits, which have a statutory deadline of 31 May. More than 650 school audits were still not completed at 30 June 2020, because schools were unable to provide their financial information to us by the required time, resulting in us being unable to complete our audits. | ||||
| Percentage of finalised reports to governors about the audit (which incorporate responses from management) that are provided within 6 weeks of signing the audit report. | 100% | 97% | 97% | 95% |
Percentage of Ministerial letters on annual audits that are issued to Ministers and Parliamentary select committees within the expected time period:
|
100% | 93% | New measure for 2019/20 | New measure for 2019/20 |
| During 2019/20, we have been identifying the challenges around timeliness. We have reviewed and codified the relevant work flows and put in place an improved process for monitoring. | ||||
Appointing auditors and monitoring audit fees
The Auditor-General appoints auditors from Audit New Zealand and private sector auditing firms to carry out the annual audits of public organisations, on his behalf. Our processes are designed to ensure that these auditors are independent, that they carry out audits of high quality, and that their audit fees are reasonable. Every year, we commission an independent review of our processes for appointing auditors and monitoring audit fees. This year's independent review again confirmed the probity and objectivity of the methods and systems that we use to allocate and/or tender audits, and to monitor the reasonableness of audit fees. Appendix 2 contains the review report.
There continues to be pressure within the audit market generally for fees to increase. This pressure comes from: increasing requirements on auditors from auditing standards and regulators' expectations, rising expectations of auditors by the organisations being audited,, and a reducing supply of auditors that is leading to increasing costs.
In 2019/20, fees increased due to:
- changes in the scale of operations of some organisations;
- new accounting standards;
- partial resetting of audit fees for district health boards, where the fees had been lower than necessary to retain auditors and achieve quality audits;
- variable quality of the financial statements and performance information prepared by some organisations; and
- small changes in auditor charge-out rates (the average hourly cost of carrying out audits).
Changes in audit fees from 2017/18 to 2019/20 are summarised in the table below. The figures exclude additional audit fees negotiated with a small number of public organisations as a result of unforeseen problems arising after audit fees were agreed.
Changes in audit fees 2017/18 to 2019/20
| 2018/19 to 2019/20 | 2017/18 to 2018/19 | |||||||
|---|---|---|---|---|---|---|---|---|
| Sector | Increase in total fee | Because of changes in time | Because of changes in charge-out rate | Number of organisations* | Increase in total fee | Because of changes in time | Because of changes in charge-out rate | Number of organisations* |
| % | % | % | % | % | % | |||
| Central government | 4.9 | 2.8 | 2.1 | 382 | 5.4 | 9.1 | (3.7) | 328 |
| Local government** | 4.8 | 8.6 | (3.8) | 266 | 2.7 | 1.2 | 1.5 | 380 |
| Schools | 3.1 | 0.5 | 2.6 | 2439 | 6.0 | 5.2 | 0.8 | 2393 |
| Total | 4.5 | 4.1 | 0.4 | 3087 | 4.6 | 5.8 | (1.2) | 3101 |
* The number of organisations are all those organisations whose audit fees were agreed at the time our analysis was prepared.
** For a number of local government organisations, auditors have proposed significantly increased audit hours. We have restricted the associated audit fee movement (largely due to the Covid-19 pandemic), effectively diluting the average hourly charge-out rates.
Carrying out quality assurance reviews
The quality of audit work carried out on behalf of the Auditor-General is paramount. We carry out quality assurance reviews of appointed auditors, usually once every three years, to ensure that they have complied with The Auditor-General's Auditing Standards. We expect all our auditors to achieve at least a "satisfactory" grade. This year, 93% of our auditors met this target. We work with those auditors who do not achieve a "satisfactory" grade to address any immediate concerns and we carry out a follow-up review. Where necessary, we make changes to auditors' portfolios.
Public organisations' satisfaction with our auditing services
Each year, our satisfaction survey (which is carried out by an external party) assesses public organisations' satisfaction with our auditing services. We surveyed about 420 public organisations and received responses from 45% of them.
Our target for public organisations' satisfaction with our audit services is that at least 85% of the organisations we survey are satisfied with their audit and the expertise of our auditors. Of the organisations that responded to our survey, 82% confirmed that they were satisfied with the services our auditors provide. This is a 6% increase from the previous year.
Timeliness of our work
The Covid-19 pandemic has had a significant adverse effect on our timeliness of completing audits. About 2400 of the 3400 audits we carry out each year are for schools. Schools are required to present their reports to us by 31 March, and we are required to audit them by 31 May each year. Unfortunately, New Zealand was in lockdown for a lot of the busiest time for school audits to be carried out.
Understanding the impact of our work
Each year, our auditors provide the governors of public organisations with reports that set out our findings and annual audit recommendations so that those with responsibility for making improvements can take action.
We implemented a new measure this year to help us better understand and report on the impact of our work. The new impact measure is focused on the implementation of recommendations for larger public organisations, which include district health boards, tertiary education institutions, government departments, and councils. We provide information about our results against the new measure earlier in this Part under the heading "Impact 3: The public sector improves its performance and accountability".
4. Carry out inquiries into matters of public interest
This service is funded through the appropriation Statutory Auditor Function MCA.
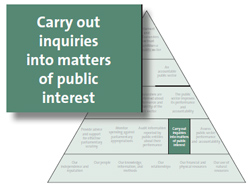 Our inquiries work is an important mechanism for improving Parliament's and New Zealanders' trust and confidence in the public sector.
Inquiries can arise from our audit or other work, requests from members of Parliament or a public organisation, or concerns raised by the public. We consider many issues and receive many requests for inquiries, with the number of requests increasing each year.
We make decisions about whether issues warrant investigation as matters of concern arise.
Performance for Carry out inquiries into matters of public interest
| Performance measure | Performance standard | 2019/20 result |
2018/19 result |
2017/18 result |
|---|---|---|---|---|
| Number of requests for inquiry received (including protected disclosures and one monitoring issue). | Not applicable | 48 | New measure for 2019/20 | New measure for 2019/20 |
| Number of protected disclosures received (this is a subset of the number above). | Not applicable | 6 | New measure for 2019/20 | New measure for 2019/20 |
| Number of pieces of inquiry work concluded during the year. | Not applicable | 42 | New measure for 2019/20 | New measure for 2019/20 |
| Number of major inquiries concluded during the year. | Not applicable | 2 | New measure for 2019/20 | New measure for 2019/20 |
| Quality | ||||
| Percentage of inquiries that meet the Auditor-General's process and reporting quality criteria (as determined by quality assurance review). | 100% | Not assessed, as not a quality assurance review year | New measure for 2019/20 | New measure for 2019/20 |
| Percentage of Parliamentary select committees that rate our reports on performance audits, inquiries, and other studies as at least "satisfactory". | 100% | 100% | New measure for 2019/20 | New measure for 2019/20 |
| Timeliness | ||||
| Percentage of preliminary investigations and routine inquiry work (excluding major inquiries) that are concluded within 6 months. | 100% | 81% | New measure for 2019/20 | New measure for 2019/20 |
| We did not achieve our timeliness target – 34 out of 42 pieces of inquiry work in this category were concluded within 6 months. | ||||
| Percentage of major inquiries that are concluded and their findings reported within the expected time period. | At least 75% | 50% | New measure for 2019/20 | New measure for 2019/20 |
| We did not achieve our timeliness target for major inquiries. We had two major inquiries for the year and, while both were concluded during the year, only one was within the agreed time frame. | ||||
| Work relating to the Local Authorities (Members' Interests) Act 1968 | ||||
| Number of Local Authorities (Members' Interests) Act 1968 requests received. | Not applicable | 96 | New measure for 2019/20 | New measure for 2019/20 |
| Percentage of requests under the Local Authorities (Members' Interests) Act 1968 for approval of contracts that are responded to within the expected time period (within 21 days). | At least 90% | 93% | Revised measure for 2019/20 | Revised measure for 2019/20 |
| We have not included the previous two years' data for this revised measure, as the changes made to both the performance standard and the expected time period to respond have both been adjusted and make the previous data non-comparable. | ||||
Our inquiry work
This year, we implemented a new way of working, which included additional resourcing and a new approach where we focus on triaging issues and working with the three categories described below:
- Category 1 – Triage/Initial view: where new potential inquiry work (either requested or self-initiated) are considered and an initial view is reached within four weeks.
- Category 2 – Assessment: where, having decided under Category 1 to do more work, we carry out inquiry work to further understand the facts and form our view of those facts.
- Category 3 – Major inquiries: this is major inquiry work, where there is an in-depth investigation of the issue and the production of a detailed report at its conclusion.
In 2019/20, we carried out work on 67 cases of Category 1, 2, and 3 inquiry work, including protected disclosures and monitoring issues. This included 19 cases that were carried over from 2018/19 and concluded in 2019/20 (15 inquiries, four monitoring issues).
In our report, Inquiry into Alpine Energy Limited's decision to install solar equipment at a senior executive's house, we considered Alpine Energy's decision to install solar energy equipment on an employee's house as part of a trial of solar energy. When the employee left the company, Alpine Energy sold the solar equipment to the employee for much less than it cost to install. Our report outlines our expectation that public organisations manage sensitive expenditure well. In that case, we saw that the installation had a legitimate business purpose, in that it was conducted as part of a trial of solar energy being carried out by the company as part of a general interest in renewable energy.
However, we also saw that the company did not recognise the expenditure as sensitive expenditure, and it was not able to demonstrate what steps it had taken at all stages of its decision-making to mitigate the risks associated with the fact that it was incurring sensitive expenditure.
In our report, Inquiry into Waikato District Health Board's procurement of services from HealthTap we considered the decision of Waikato District Health Board in 2015 to enter into a two-year licence contract with a United States-based company to provide "virtual care" services through an online service. That report includes important messages for all public organisations about the importance of following good procurement practices so that good decisions are made about spending public money and the public can see how those decisions were made. In that case, some of those procurement disciplines were missing (such as proper planning, formal market testing, a competitive tender process, sound business cases and a procurement plan, and involving legal and procurement specialists at the right time).
Timeliness of our inquiry work
While we did not meet our timeliness targets for our three inquiry categories, this remains a key focus for us as we embed our new way of working. It can be challenging to balance the obligations of fairness and natural justice inherent in our work, and the volume and complexity of the issues we consider, with being timely.
This year, we re-allocated some of our resources to assist with other Office priorities, such as the cross-Office project teams that reviewed how the New Zealand Police implemented the firearms buy-back and amnesty scheme and the Ministry of Health's management of personal protective equipment in response to the Covid-19 pandemic, as described in the cross-Office highlights on pages 36-37. This aims to provide more timely assurance on issues as they emerge, and we expect there will be more of this type of work in the future.
Understanding the impact of our work
In our work, we have an opportunity to consider a situation in more detail to understand what has happened and what lessons there are, so the public organisation, and the public sector, might continue to improve the services it provides to New Zealanders. In some cases, that work can have an immediate or short-term effect, with the organisation acknowledging that the situation could have been avoided or done differently. In other situations, a public organisation might consider what has been learned from our inquiry and choose to do some things differently, then evaluate what they have done differently and report about that. At the time of our report about the Waikato District Health Board, the Board said publicly that it "… accepted the findings of the report and that it will be a useful tool for driving improvement in our organisation".
In 2016, we published the findings for our inquiry into the Saudi Arabia Food Security Partnership (the Partnership). In our report, we said that we expected the Ministry of Foreign Affairs and Trade (the Ministry) and New Zealand Trade and Enterprise (NZTE) to assess and report on what the Partnership has achieved once all of the goods and services covered by the contract for services were provided.
In February of this year, when they considered that the Partnership had concluded, the Ministry and NZTE wrote to the Auditor-General saying that they have fully accepted our report, that in totality the arrangement did not represent a good return on investment, that the Partnership was not a mechanism they would use or recommend, and that they have incorporated the lessons learned from our findings into their business practices.
Local Authorities (Members' Interests) Act 1968
The Auditor-General also administers the Local Authorities (Members' Interests) Act 1968 (LAMIA), which regulates pecuniary interest matters in local government. This year, we received 96 enquiries relating to the LAMIA. Of these, the majority were requests for approval of contracts. We measure our timeliness for those requests from the time when we have all the information we require to carry out our work. This year, we completed 93% of LAMIA-related requests for approval of contracts within our target of 21 days.
5. Assess public sector performance and accountability
This service is funded through the appropriation Statutory Auditor Function MCA.
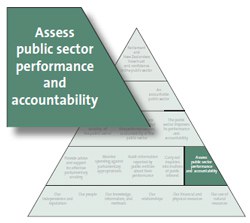 The Public Audit Act 2001 allows the Auditor-General to assess the performance and accountability of public organisations, particular sectors, or the public sector as a whole. Performance audits, special studies, and the other evaluation and assessment work we do are an important part of our work programme.
Performance audits enable us to delve more deeply into particular areas than we are able to in our annual audits, and make recommendations for improving public sector performance. We also monitor public organisations' progress in implementing the recommendations from our previous performance audits.
Performance for Assess public performance and accountability
| Performance measure | Performance standard | 2019/20 result | 2018/19 result | 2017/18 result |
|---|---|---|---|---|
| Number of performance audit reports issued during the year. | Not applicable | 4 | New measure for 2019/20 | New measure for 2019/20 |
| Number of other reports issued during the year. | Not applicable | 14 (See Appendix 4) |
New measure for 2019/20 | New measure for 2019/20 |
| Quality* | ||||
| Percentage of performance audits that meet the Auditor-General's process and reporting quality criteria (as determined by quality assurance review). | 100% | 100% | Revised measure for 2019/20 | Revised measure for 2019/20 |
| We selected a representative sample of three completed performance audits to assess compliance with the Auditor-General's auditing standard for performance audits. Overall, the performance audits sampled were found to have substantively met the requirements of this standard. Where compliance gaps were identified, the impact to the audit was assessed as not significant. | ||||
| Percentage of Parliamentary select committees that rate our reports on inquiries, performance audits, and other studies as at least "satisfactory". | 100% | 100% | Revised measure for 2019/20 | Revised measure for 2019/20 |
| Percentage of audited entities that rate our performance audits as at least "satisfactory". | At least 85% | 88% | Revised measure for 2019/20 | Revised measure for 2019/20 |
| We sent a voluntary survey to the 13 public organisations that participated in the four performance audits we completed in 2019/20. We received eight responses. Seven of the public organisations that responded rated our performance audits as "at least satisfactory", and one was neutral. We used a 5-point survey scale, ranging from strongly disagree to strongly agree. Responses were assessed as "at least satisfactory" if they responded with agree or strongly agree. | ||||
| * Our quality measures were revised for 2019/20 to improve how we assess and explain our performance specifically in relation to the quality of our performance audits. Previous measures assessed the quality of all of our work under the Statutory Auditor Function MCA appropriation. This is no longer reflected in our reporting. | ||||
| Timeliness* | ||||
| Percentage of performance audits that are concluded and their findings reported within the expected time period. | At least 75% | 0% | New measure for 2019/20 | New measure for 2019/20 |
| * Our timeliness measure was revised for 2019/20. The previous measure assessed the timeliness of not only performance audits but also other reports funded under the Statutory Auditor Function MCA appropriation (excluding Controller updates and inquiries reports, as they were reported elsewhere). | ||||
Our performance audits and special studies work
Every year, we carry out a wide range of work to assess public sector performance and accountability. Our overall work programme includes initiatives from our published annual plan. In 2019/20 we carried out work on 11 performance audits and four of these were completed by 30 June 2020. The progress against each of these performance audits is outlined in Appendix 5.
All of the work we published across the Office in 2019/20, including the four performance audit reports and the 14 other reports issued this year is described in Appendix 4 under the headings Performance audits and Other published reports and studies. This work is also available on our website. Our Controller updates and inquiries reports are excluded from Appendix 4, as they are reported elsewhere.
Performance audits continue to be an important part of our work programme. Their purpose is to influence improved public sector performance and provide assurance to Parliament, public organisations, and the public that public organisations are delivering what they have been set up and funded to do.
Timeliness of our work
Timeliness for completing our work remains an ongoing focus. This year we expected to complete 10 performance audits. Four of these were delivered within the financial year, but none of the four were completed within their planned time frames. Of the remaining six, four have now been completed. The other two performance audits will also be completed in 2020/21.
A number of key factors have affected the delivery time frames that were set for our performance audits, including recruitment delays for key performance-audit-related positions and the disruption that the Covid-19 pandemic caused to our ability to carry out this work. We also re-allocated resources to assist with other Office priorities, such as the cross-Office project team that carried out our review of the Ministry of Health's management of personal protective equipment in response to the Covid-19 pandemic, as described in the cross-Office highlights on page 36. This aims to provide more timely assurance on issues as they emerge, and we expect there will be more of this type of work in the future. The performance audits in our work programme can be complex and involve managing many dependencies that can affect timeliness. We will continue to look at how performance audit time frames are set, at how dependencies can be better managed, and for ways to make the insights from our work available in a timely way.
Understanding the impact of our work
Each year, we assess the progress public organisations make in acting on the recommendations from a selection of our previous performance audits. Generally, we follow up after 18 to 24 months. This allows public organisations time to make any necessary changes. The selection of audits we follow up on is based on the significance of the areas identified for improvement in the performance audit report, the time that has elapsed since our recommendations were made, and the resources we have available to assess progress. We provide additional information about the impact of our work in this Part under the heading: "Impact 3: The public sector improves its performance and accountability" (see pages 20-21).
Cross-Office highlights
Our report on the Ministry of Health’s management of personal protective equipment during the Covid-19 pandemic
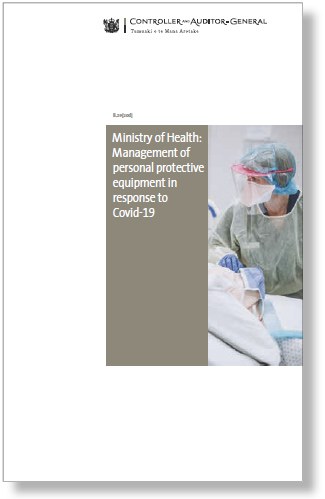 In times of crisis, people need to have trust and confidence in the systems and arrangements set up to support them. In April 2020, we agreed with the Ministry of Health (the Ministry) to independently review its management of personal protective equipment (PPE) during the early stages of the country’s response to the Covid-19 pandemic. To ensure that we could provide timely assurance on these issues, we re-prioritised our resources and established a cross-Office project team to carry out this work.
In June 2020, we published our report, Ministry of Health: Management of personal protective equipment in response to Covid-19. Our report outlines how the Ministry and district health boards (DHBs) had planned for a national health emergency and maintained a national reserve supply of critical clinical items, including PPE, to ensure that health services have continued access to PPE during large or prolonged emergencies. However, we found gaps in the Ministry’s planning and a lack of clarity over roles and responsibilities for both planning for, and providing, PPE in a pandemic, including not being aware how much reserve stock there was and the lack of a system to forecast demand.
The Ministry and DHBs worked hard to adapt their processes during the lockdown phases of the country’s response to the Covid-19 pandemic. The Ministry set up a new centralised system for procuring, prioritising, and distributing PPE stock. We made 10 recommendations to help strengthen the management of PPE, which the Ministry moved quickly to start implementing. Further information about what we found and recommended is in the report available on our website.
Our report on the Police’s implementation of the firearms buy-back and amnesty scheme
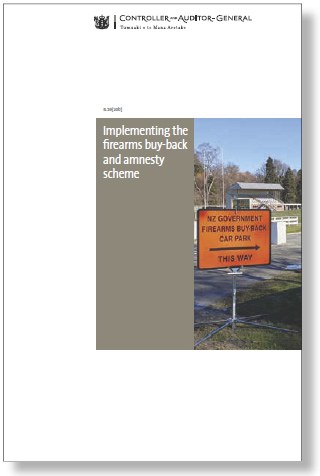 As part of its response to the Christchurch mosque attacks on 15 March 2019, the Government introduced a firearms buy-back and amnesty scheme (the scheme). The scheme allowed owners of newly prohibited firearms, magazines, and parts to hand them in to the Police in exchange for compensation. We examined how effectively and efficiently the Police implemented the scheme.
Rather than waiting for the Police to complete the scheme and then examine their performance, our appointed auditor looked at the Police’s performance as the scheme was operating. We thought it important to provide the Police with real-time feedback so that they could make any improvements the scheme needed quickly. We supplemented the real-time feedback of our appointed auditor with work carried out by a three-person cross-Office project team. This cross-Office approach, and working in combination with our appointed auditor in real time, was a different way of working compared to our traditional approach.
The Police were open to receiving and acting on the feedback and made some changes to their practice during the operation of the scheme.
We recommended that the Police evaluate and report on the difference made by changes to firearms regulation and implementation of the scheme. This will include work aimed at better estimating the number of prohibited firearms still in the community. Having that information should help to get a better sense of the level of public compliance with the scheme. Without that information, we cannot determine whether the Police’s implementation of the scheme has delivered value for money.
The Police have committed to implementing our recommendations.
Further information about what we found and recommended is in our report, Implementing the firearms buy-back and amnesty scheme, which is available on our website.

