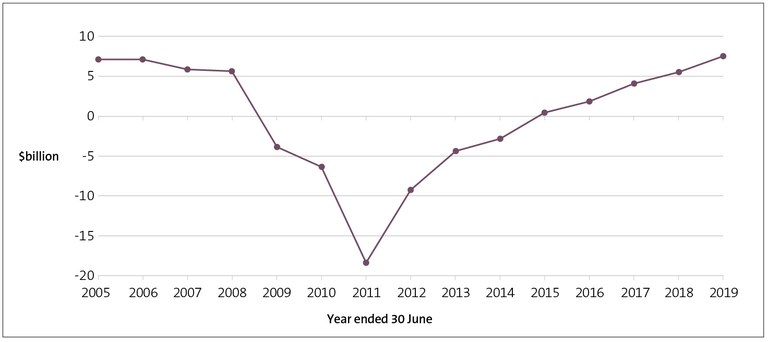
Figure 1 - The Government’s operating balance before gains and losses, from 2005 to 2019
The figure shows the operating balance before gains and losses. There was a drop for three years from 2008, but it has gone up each year from 2011. Source: Adapted from The Treasury (2019) FSG Basics and (2010) Financial Statements of the Government of New Zealand for the year ended 30 June 2010, at treasury.govt.nz.
https://oag.parliament.nz/2019/central-government/media-kit/the-governments-operating-balance.jpg/view
https://oag.parliament.nz/2019/central-government/media-kit/the-governments-operating-balance.jpg/@@download/image/The Government's operating balance.jpg
Figure 1 - The Government’s operating balance before gains and losses, from 2005 to 2019
The figure shows the operating balance before gains and losses. There was a drop for three years from 2008, but it has gone up each year from 2011. Source: Adapted from The Treasury (2019) FSG Basics and (2010) Financial Statements of the Government of New Zealand for the year ended 30 June 2010, at treasury.govt.nz.


