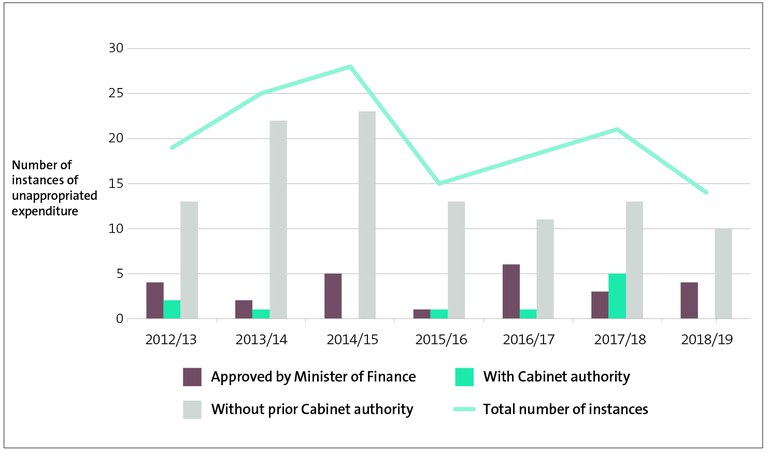
Figure 8 - Number of instances of unappropriated expenditure by category, from 2012/13 to 2018/19
The figure shows, from 2012/13 to 2018/19, the number of instances each year of three categories of unappropriated expenditure: unappropriated expenditure approved by the Minister of Finance, unappropriated expenditure with Cabinet authority, and unappropriated expenditure without prior Cabinet authority. The highest number of instances every year, from 2012/13 to 2018/19, was unappropriated expenditure without prior Cabinet authority.
https://oag.parliament.nz/2019/central-government/media-kit/instances-of-unappropriated-expenditure-by-category.jpg/view
https://oag.parliament.nz/2019/central-government/media-kit/instances-of-unappropriated-expenditure-by-category.jpg/@@download/image/Instances of unappropriated expenditure by category.jpg
Figure 8 - Number of instances of unappropriated expenditure by category, from 2012/13 to 2018/19
The figure shows, from 2012/13 to 2018/19, the number of instances each year of three categories of unappropriated expenditure: unappropriated expenditure approved by the Minister of Finance, unappropriated expenditure with Cabinet authority, and unappropriated expenditure without prior Cabinet authority. The highest number of instances every year, from 2012/13 to 2018/19, was unappropriated expenditure without prior Cabinet authority.


