Part 4: Asset investment decision-making
4.1
In this Part, we set out:
- how funding arrangements for DHBs deal with capital investment decisions; and
- what financial statements tell us about management of capital expenditure.
4.2
Many factors can influence the results of the financial measures we assessed – in particular, the quality of the underlying asset management information. Therefore, we consider that each DHB should examine this financial analysis further, along with the improvements in asset management information we described in Figure 3.
4.3
We found that, for all DHBs14 since 2009:
- Capital expenditure is more than depreciation but is highly variable between DHBs. This suggests that, although some DHBs are renewing or replacing their existing asset bases as they are consumed over time, others are not.
- Actual capital expenditure is less than budget. This suggests that DHBs might not be carrying out the capital expenditure needed to deliver their services in the future and to maximise the useful life of their assets.
- Almost half of DHBs' capital expenditure is funded externally (through Crown debt or equity) rather than internally through DHBs' net operating cash flows, indicating that DHBs rely heavily on funding from the Crown to replace and renew assets.
How do funding arrangements for DHBs deal with capital investment decisions?
4.4
A population-based funding formula has been used since 2003 to determine the share of funding to be allocated to each DHB.
4.5
Under section 41 of the New Zealand Public Health and Disability Act 2000 and section 51 of the Crown Entities Act 2004, every DHB must operate in a financially responsible manner. They must:
- endeavour to cover all their annual costs (including cost of capital) from their net annual income;
- prudently manage their assets and liabilities;
- endeavour to ensure their long-term financial viability; and
- act as a successful going concern.
4.6
Under its Operational Policy Framework, the Ministry requires each DHB to operate within the total funding agreed through the Annual Plan process and ensure that it is not overcommitting itself. If it appears likely that a DHB will run a deficit or be unable to meet its cash flow commitments at any time, the DHB must immediately advise the Ministry. DHBs are advised to be aware that deficit support funding will be provided only where the DHB cannot fund its deficits from its own balance sheet. There are constraints on how this funding can be applied.15
4.7
Additional funding is provided within Vote Health for debt or equity for DHBs or health sector Crown agencies to cover new investments or balance sheet reconfiguration, or to invest in specific health-sector assets. In 2015/16, this multi-year appropriation was $768 million.
4.8
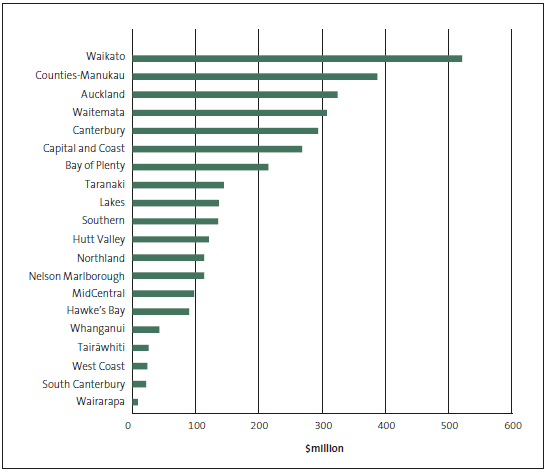
Capital expenditure by all 20 DHBs from 2008/09 to 2014/15 has been nearly $3.4 billion. Figure 12 shows that most of this expenditure has occurred in Waikato and the greater Auckland area and, to a lesser extent, in Canterbury.
Figure 12
Capital expenditure by district health board, 2008/09 to 2014/15
4.9
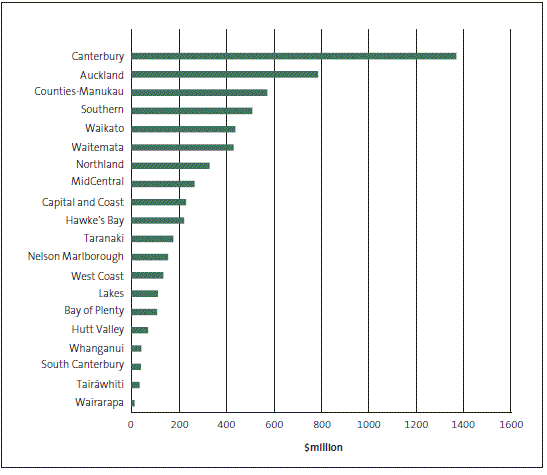
Proposed capital investment in all 20 DHBs for the next 10 years is forecast to be more than $6 billion. More than a third of this expenditure is forecast to be spent in the high-growth Auckland and Waikato areas and 23% in the Canterbury area. The Treasury's Ten-Year Capital Intentions Plan 2014/15 says that "capital prioritisation will need to be made in years 5-10 to balance the needs of the growing population in the Northern Region with the need for replacement of some South Island and Auckland Region facilities".16
4.10
Figure 13 shows forecast capital expenditure by DHB over the next 10 years from 2014/15 to 2023/24.
Figure 13
10-year forecast capital expenditure, by district health board
4.11
In commenting on the draft of this report, several DHBs expressed concern that 10-year forecasts are likely to be understated. They said that, historically, DHBs planned their capital expenditure three to five years ahead but are now planning 10 years ahead. This change in approach means that new needs are being identified when forecasts are made.
4.12
The Health Strategy Update and the two independent reviews carried out as part of the update noted the following:
- There is a lack of visibility of results that makes it hard to prioritise funding or take into account long term, cross-sectoral benefits from investment.
- Service mix and design changes are too slow to address changes in demand. Often our funding and contracting arrangements embed the status quo, instead of allowing us to work differently.17
- DHBs often operate in regional and financial isolation, rather than jointly within a New Zealand-wide system, focused on long-term health outcomes.
- Boards and executives are primarily held accountable for their DHB "working within their financial means" while meeting the Government's priority KPIs (in primary and secondary care). There is a lack of incentives to support improved performance in other DHBs, especially those nearby in terms of geography or care specialties.
- Enabling infrastructure issues which impact the whole system are often negotiated with each of the 20 individual DHBs. Decisions are then made based on the short-term fiscal impact on each of the DHBs, rather than for a national whole-of-system benefit.18
4.13
In our previous reports to Parliament on the results of our audits in the health sector, we have noted that DHBs were working to improve their financial performance by seeking efficiency and productivity gains in clinical and support services.19
4.14
During our 2014/15 annual audits, we observed that some DHBs seem overly focused on achieving a particular bottom-line result. Our auditors noted that DHBs are managing their financial results carefully with the objective of reporting close to break-even or budgeted surplus or deficits. DHBs need to approach the cut-offs for financial year-end final balances and amounts, and valuation assumptions consistently, without bias to the desired year-end result.20
4.15
Our 2013 report Regional services planning in the health sector identified issues in major investment planning (see paragraphs 2.20-2.24). We reported that:
- Regional capital committees do not generally appear to be influencing or setting priorities for major investment in buildings based on regional services planning. Regional lists continue to look more like a summation of the separate DHB plans.
- Intended capital spending for the next 10 years, based on a notional budget for each region, is now included in the Treasury's Ten-Year Capital Intentions Plan. However, the effects of these initiatives on operational and capital maintenance and renewal costs are not always reflected in DHB funding.
4.16
In our work for this report, we saw no evidence that the situation we described in our 2013 report had significantly changed. Therefore, we looked at three capital expenditure measures in DHBs' financial statements for the past seven years to see what they might suggest about how DHBs are managing capital expenditure:
- We looked at capital expenditure to depreciation as a proxy for what DHBs need to spend each year to renew or replace their existing asset base as it is consumed over time. We expected capital expenditure to be at, or greater than, 100% of depreciation.
- We looked at actual to budgeted capital expenditure because DHBs should forecast and spend the capital expenditure needed to continue to deliver their services and to optimise the useful life of their assets. We expected actual expenditure to be within +/-10% of budgeted capital expenditure.
- We looked at net operating cash flows to capital expenditure as an indication of the extent to which DHBs are able to fund their asset reinvestment (including building the financial reserves to replace and renew assets) internally rather than through Crown debt or equity. As discussed in paragraphs 4.5 and 4.6, DHBs are expected to operate in a financially responsible manner, so this ratio should be at, or greater than, 100%. However, as noted in paragraph 4.7, additional funding is provided within Vote Health, including for investments in specific health-sector assets.
4.17
We looked at these measures in two ways:
- the aggregate result, since the Ministry required DHBs to document their approach to asset management in asset management plans, from 2008/09 to 2014/15; and
- the overall result in these measures for DHBs compared to two other types of public sector entities: local authorities and tertiary education institutions.
4.18
We looked at the measures in aggregate because it removes the fluctuations that occur between years and between DHBs, to focus on the overall result for DHB asset management.
4.19
Although local authorities and tertiary education institutions have different purposes, natures, and responsibilities than DHBs, they also share some similarities that mean it is useful to compare. These similarities are that they manage both building and specialist equipment assets to deliver public services, elections are used to appoint some or all of the governing body members, and they rely on rate or taxpayer funding as a major source of revenue.
Managing capital expenditure
4.20
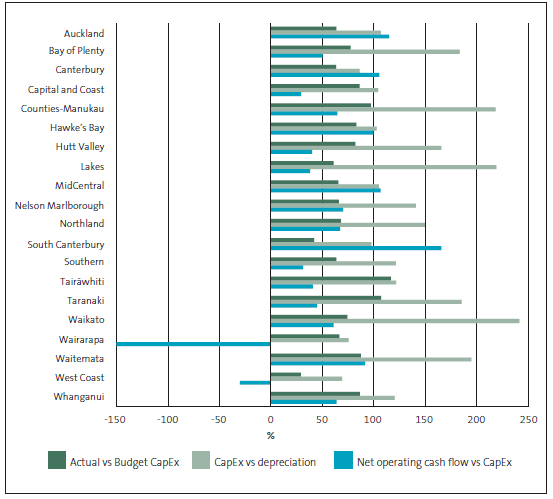
Figure 14 shows that, on average, for all DHBs:
- capital expenditure is more than depreciation (the average is 140%) but is highly variable between DHBs;
- actual capital expenditure is less than budget (the average is 74%); and
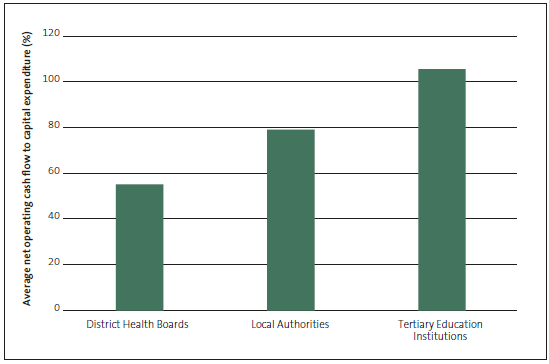
- just over half of all capital expenditure is funded internally through DHB net operating cash flows (the average is 55%), rather than externally.
4.21
Figure 14 also shows that the results for the three measures are quite variable by DHB.
4.22
Counties Manukau, Taranaki, and Waitemata DHBs were in the first five of all 20 DHBs for two or more of these measures.
4.23
West Coast, Wairarapa, Capital and Coast, Lakes, and Southern DHBs were in the bottom five for two or more these measures.
4.24
West Coast, Wairarapa, and Capital and Coast DHBs also had letters of support for each of the past five years. Letters of support are letters from the Ministers of Health and Finance to the governors of DHBs in financial difficulties to provide assurance that the DHBs remain a going concern.
4.25
These three DHBs were included in the nine DHBs whose asset management maturity self-assessments were reviewed by AECOM. They received average or better ratings compared to the other six AECOM reviewed, suggesting no obvious relationship between the maturity of their asset management practice and capital expenditure management.
Figure 14
Capital expenditure measures by district health board, 2008/09 to 2014/15
Capital expenditure to depreciation
4.26
Depreciation is an accounting estimate of the consumption of, or the cost of using up, an asset. It is relatively uniform compared to capital expenditure, which can be more variable from year to year depending on what asset renewals and/or replacements are needed. Comparing the two over time can indicate whether enough is being spent on renewing the existing asset base.
4.27
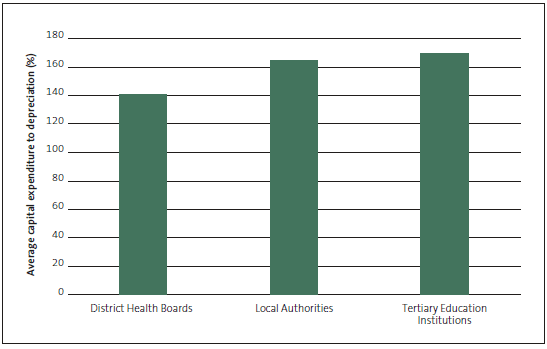
Capital expenditure above depreciation (100% or more) might suggest that DHBs are spending enough to renew the existing asset base. However, as Figure 15 shows, DHBs have lower percentages of capital expenditure to depreciation than local authorities and tertiary education institutions.
Figure 15
Average capital expenditure to depreciation for district health boards compared with local authorities and tertiary education institutions, 2008/09 to 2014/15
4.28
There is also considerable variability in the relationship between capital expenditure and depreciation between individual DHBs (see Figure 14). This variability indicates that different DHBs have very different asset circumstances (for instance, age and condition).
4.29
The usefulness of capital expenditure to depreciation as an indicator is stronger when information about the age, remaining useful life, and likely replacement cost is reliable. In paragraph 3.11, we noted that clinical equipment is valued at historical cost and appears to be a long way through its useful life. This could mean that clinical equipment is not being maintained and replaced, and that information about its useful life is not being kept up to date.
4.30
Capital expenditure that is more than depreciation suggests additional reinvestment above the consumption of existing assets. However, in some circumstances, such as where depreciation is based on the assets' historical cost, capital expenditure might need to be 150% or more to suggest reinvestment above consumption.
4.31
Lower capital expenditure compared to depreciation – for instance, by West Coast21 and Wairarapa DHBs – suggests reinvestment below the consumption of existing assets. Underspending on renewals by DHBs over time could affect the level of service that they can provide in the future.
4.32
Figure 12 shows that, between 2008/09 and 2014/15, major capital expenditure has occurred in the Waikato, Waitemata, Auckland, Counties Manukau, and Canterbury DHBs. Christchurch hospital facilities damaged by the Canterbury earthquakes are now being redeveloped. (We have reported separately on the governance of the Canterbury DHB Acute Services Rebuild in our report Governance and accountability for three Christchurch rebuild projects.)22
4.33
We tried to analyse capital expenditure by category (renewals or replacement) to understand where any capital underspending might be and what effect it might have. Renewals expenditure is important because it allows services to continue to be delivered from asset investments that have already been made.
4.34
Although most DHBs told us that they categorise renewals separately from new assets, we could not obtain enough evidence to support the categorisation of 15 DHBs.
4.35
For the five whose categorisation we could obtain evidence of, for buildings, capital expenditure is about 40% for renewal of existing assets and 60% for new assets. For clinical equipment, capital expenditure is around 75% for renewal of existing assets and 25% for new assets. Although this is only five of the 20 DHBs, the results support our analysis in Part 3, which suggests that clinical equipment is a long way through its useful life and that there has been limited investment in clinical equipment for some years.
Actual to budget capital expenditure
4.36
From 2008/09 to 2014/15, DHBs collectively spent $1.180 billion less on capital expenditure than budgeted. On average, the actual to budgeted capital expenditure for DHBs is 74%.
4.37
DHBs and the Ministry told us there are various reasons for the differences between forecast and actual capital expenditure. These reasons can include:
- aspirational budgeting and/or poor planning, such as being too optimistic about timing;
- reprioritising capital expenditure in response to other priorities and events; and
- getting better contract rates than those budgeted for.
4.38
Figure 16 shows that the difference between actual and budgeted capital expenditure is greater for DHBs than it is for tertiary education institutions and local authorities.
Figure 16
Average actual to budgeted capital expenditure for district health boards compared with local authorities and tertiary education institutions*, 2008/09 to 2014/15
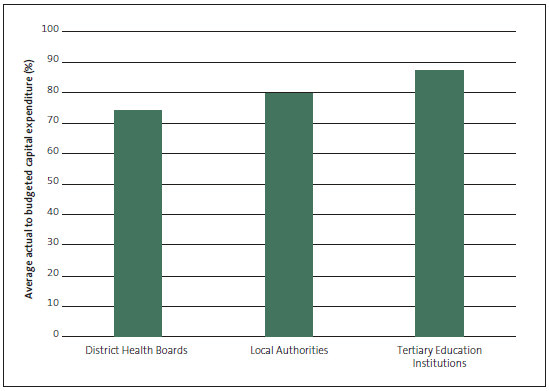
* For the TEI data, no parent budget data was available for Auckland University and UCOL, so we used group numbers.
4.39
As with the relationship of capital expenditure to depreciation, the average actual to budgeted capital expenditure by DHBs is highly variable (see Figure 14).
4.40
In some DHBs, the effect of significant capital rebuild programmes can be seen in the relationship between actual and budgeted capital expenditure. Auckland, Canterbury, and South Canterbury DHBs have lower-than-average actual to budgeted capital expenditure (less than 65%). However, other DHBs with large rebuild programmes (Waitemata, Counties Manukau, and Capital and Coast) achieved higher actual to budgeted results (more than 85%).
4.41
These results suggests that DHBs might be able to share practices and experience to improve the delivery of rebuild projects.
4.42
Results for DHBs that were not carrying out significant rebuilds were very mixed. Taranaki and Tairawhiti DHBs spent more on capital than they budgeted, while West Coast DHB had the lowest relationship (under 30%). Very low results merit further exploration by the DHBs concerned and the Ministry.
4.43
The Ministry has reviewed the Waikato and Canterbury DHBs, to explore and discuss the financial and management consequences of significant building redevelopments for DHBs.23
4.44
PwC's Canterbury DHB: Stage One Financial Review to the Ministry was high level and intended to be further refined in a Stage Two Financial Review. But the review makes clear that Canterbury DHB's capital-driven costs (capital charge, interest, and depreciation) are significant drivers of its bottom-line financial performance. These costs are forecast to increase by about 85% during the next six years. As a result, PwC considered specific analysis "absolutely critical" to understand the interrelationship between:
- capital spend, timing of the spend and how it is accounted for;
- equity and revenue injections from the Crown;
- any debt drawdowns;
- interest and capital charges; and
- depreciation run-off.24
4.45
Although Canterbury DHB's capital programme is unique in its scale, understanding the interrelationship of these factors will be important for other DHBs managing large capital projects.
Net cash flows from operations to capital expenditure
4.46
Given the Operational Policy Framework expectation that each DHB operate within agreed funding (see paragraph 4.6), we looked at net operating cash flows to capital expenditure to see whether DHBs are building up enough financial reserves to replace and renew assets.
4.47
The cash that remains after all operating expenses are paid (net cash flows from operations) is a DHB's first, and most controllable, funding option for investing in its assets. External funding sources are primarily Crown funding for major projects (as discussed in paragraphs 4.6 and 4.7) and loans. They can also include reserves generated by DHBs that are held by the Crown and community fundraising.
4.48
The proportion of net operating cash flow to capital expenditure can indicate how closely operational activities are co-ordinated with asset investments and the level of control the DHB has over the funding of its asset investment plans. A low proportion indicates less potential co-ordination and less direct control. A high proportion indicates the reverse.
4.49
Although DHBs use internal sources of funding to pay for capital expenditure, our analysis showed that, between 2008/09 and 2014/15, internal funding from net operating cash flows covered only 55% of DHBs' total capital investment needs.
4.50
Figure 17 shows that other asset-intensive sectors have significantly more internal funding. This allows the entities to cover more of their total capital expenditure needs.
Figure 17
Average net operating cash flow to capital expenditure for district health boards compared to local authorities and tertiary education institutions, 2008/09 to 2014/15
4.51
Using depreciation as a proxy for how much is being consumed, our analysis also showed that 12 of the 20 DHBs (60%) did not have enough internally generated funds to cover their renewal spending needs. This compares with 22 out of 78 local government entities (28%) and one out of 29 tertiary education institutions (3%).
Other factors affecting capital expenditure decisions
4.52
We explored several factors from the information about asset management that we collected for this report, to see whether any of these were correlated with a DHB's level of capital expenditure per dollar value of assets. These factors were the results of DHBs' self-assessed asset management maturity, the age of assets, and the value of assets. We found little relationship between the level of capital expenditure per dollar value of assets and the above factors, which is consistent with the observation we made in paragraphs 4.24 and 4.25 about the asset management maturity of the three DHBs that have received letters of support for the past five years. However, we considered that there should have been some correlation between at least the age of the asset and the level of capital expenditure per dollar value of assets.
4.53
We also looked at DHBs' ability to forecast and prepare to fund their own capital expenditure needs by looking at the correlation of asset management factors with the extent of internal funding available for capital expenditure. We thought we might, for instance, see a correlation between older assets and increasing ratios of net operating cash flow to capital expenditure as DHBs build up financial reserves in preparation for replacing or renewing older assets. We did not find any significant relationships.
4.54
We discussed the three capital expenditure relationships and the results of our analysis of the specific information we collected about building and clinical equipment at a workshop with DHB asset and finance management practitioners and advisers, and staff of the Ministry and the Treasury.
4.55
Their comments echoed many of the concerns identified by the two independent reviews and the Health Strategy Update. This suggests that the concerns these reviews identified also affect DHB asset planning, management, and decision-making.
4.56
DHB asset and finance management practitioners confirmed that immediate financial and operational imperatives sometimes dominate decision-making. This creates incentives to defer capital expenditure:
- Budgeted capital expenditure can be diverted to short-term operational expenditure.
- New and well-maintained assets generally have a higher value than older assets and so incur additional operational expenses (such as depreciation expense and capital charges). By not incurring capital expenditure, these operational expenses can be avoided in the short term.
- DHBs often need to accumulate cash reserves over several years to fund major capital needs. However, in generating surpluses, DHBs can be publicly perceived as failing to provide the fullest possible extent of service to the public. The Ministry has noted that, in the past, some DHBs have "banked" surpluses to build up reserves for major capital projects.25
- The nature of assets needed for health services are changing (as discussed in Part 2). New capital expenditure needs (for example, through the HBL initiative) need to be accommodated within existing capital expenditure budgets. We reported separately on the results of our inquiry into Health Benefits Limited in October 2015.
| Recommendation 5 |
| We recommend that each DHB link its asset management planning to its other service and financial planning. |
| Recommendation 6 |
| We recommend that the Ministry of Health and the Treasury review the interaction of service, funding, and asset planning, with the aim of providing incentives for DHBs to balance short-term results with longer-term service and asset management needs. |
14: The financial statement analysis in this section uses parent data and excludes Otago and Southland DHBs, which were merged into Southern DHB in 2010.
15: See Ministry of Health (2015), Operational Policy Framework 16/17, sections 12.7 and 12.15.
16: See http://www.infrastructure.govt.nz/plan/2015.
17: Ministry of Health (2015), Update of the New Zealand Health Strategy: All New Zealanders live well, stay well, get well: Consultation draft, page 7. See also Ministry of Health (2015), From Cost to Sustainable Value: An Independent Review of Health Funding in New Zealand, commissioned by the Director-General of Health, page 15.
18: Suckling, Connolly, Mueller, and Russell (2015), The New Zealand Health System: Independent Capability and Capacity Review.
19: Office of the Auditor-General, Health Sector: Results of the 2011/12 audits, part 5, and Health Sector: Results of the 2012 /13 audits, part 4.
20: Address by the Auditor-General to the Health Sector Finance Workshop, 20 October 2015.
21: West Coast DHB is preparing to rebuild the Grey Base Hospital in Greymouth.
22: See http://www.oag.govt.nz/2015/christchurch-projects.
23: Ministry of Health (2014), Review of opportunities for the incoming chief executive, and PwC (2015), Canterbury DHB: Stage One Financial Review, Report to the Ministry of Health.
24: PwC (2015), Canterbury DHB: Stage One Financial Review, Report to the Ministry of Health, page 14.
25: See, for instance, Ministry of Health (2014), Review of opportunities for the incoming chief executive, pages 8 and 25-26.

