Current performance
Overall, the performance of New Zealand’s public services is relatively good. Our public services benchmark well against other countries and New Zealanders are generally satisfied with public services that they receive. At the same time, there are some enduring pressure points where performance has been weaker. This foundation of good performance – and the trust that New Zealanders have in their public services – offers a strong basis for the response to future challenges and opportunities.
Overall performance
New Zealand public services perform well and contribute to positive outcomes for New Zealanders. Different indices focus on different measures of performance. Looking across internationally-consistent composite indices, New Zealand public services are consistently at or near the top of the class.
The World Economic Forum’s Global Competitiveness Index has been produced annually by the World Economic Forum since 1979, and covered 144 economies in 2014-15. The index follows 12 pillars of competiveness1. New Zealand ranks ahead of the averages for advanced economics across most pillars in this index, ranking 17th out of 144 for all indicators.2
New Zealand ranks highest for those Global Competitiveness Index pillars that are strongly tied to the contribution made by public services. We rank first on the quality of institutions, following indicators such as protection of property rights and intellectual property, public trust, wastefulness of government spending, the transparency of government policy making and the reliability of police services. We also rank highly for the health and primary education pillar (fourth overall, fourth for indicators following primary education, but 21st for indicators following health), and the higher education and training pillar (ninth overall and fifth for the indicator following secondary education enrolment).3
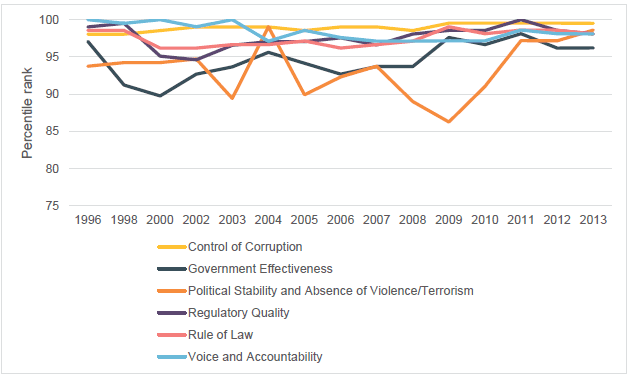
The World Bank’s Worldwide Governance Indicators cover around 215 economies and explore six dimensions of governance, drawing on 32 individual data sources. Figure 1 shows that New Zealand has consistently ranked above the 95th percentile for four of the six dimensions, and, over the last three years, it has ranked above the 95th percentile for all six dimensions. In 2013, New Zealand was above the 98th percentile for five of the six dimensions.4
Figure 1: Worldwide Governance Indicators

Source: World Bank
Unpacking composite indices, New Zealand generally ranks among the best or above the OECD median for governance and education. It slips however for indicators following health outcomes. Table 1 shows New Zealand’s ranking against OECD countries across a range of general governance, health and education indicators.
Table 1: General governance, health and education indicators
| Indicators | Ranking (among 34 OECD countries) |
| Governance | |
| Property rights | 8 |
| Intellectual property protection | 5 |
| Ethics and corruption | 1 |
| Undue influence | 1 |
| Government efficiency | 3 |
| Security | 5 |
| Strength of investor protection | 1 |
| Health | |
| Life expectancy at birth (female) | 20 |
| Life expectancy at birth (male) | 8 |
| Infant mortality, deaths per 1 000 live births | 29 |
| Potential years of life lost5 (per 100,000 females) | 26 |
| Potential years of life lost (per 100,000 males) | 19 |
| Intentional self-harm, deaths per 100 000 population | 22 |
| Public expenditure on health as a percentage of GDP | 11 |
| Education | |
| Expected years in education (from age 5 to 39) | 12 |
| Student performance in maths (mean score) | 16 |
| Student performance in reading (mean score) | 9 |
| Student performance in science (mean score) | 11 |
| Proportion of 25-34 year-olds who have attained at least upper secondary education | 26 |
| Proportion of 25-34 year-olds who have attained a tertiary education degree | 8 |
| Public expenditure on education as percentage of GDP (all levels) | 3 |
Source: OECD, 2012 (or closest data), World Economic Forum, 2014
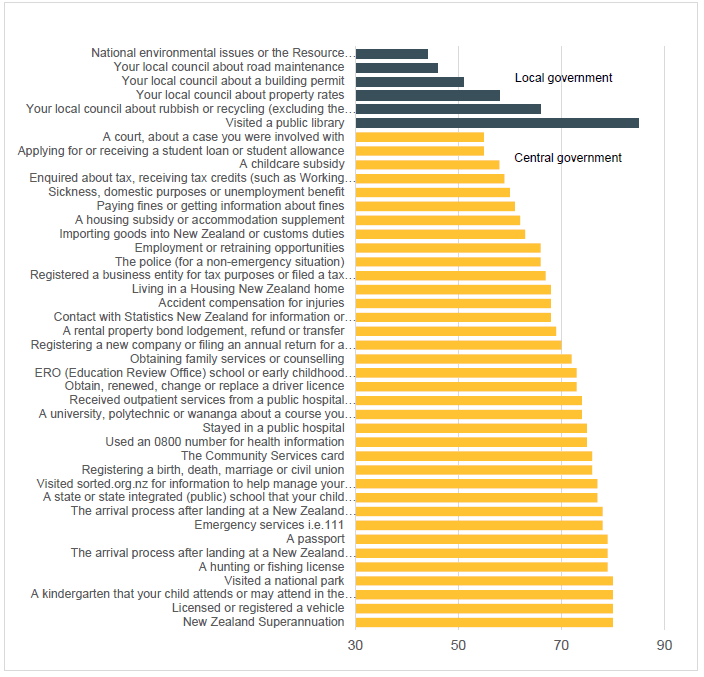
New Zealanders also hold public services in reasonably high regard. Since 2007, a sample of New Zealanders has been surveyed to measure satisfaction with a wide cross-section of public services through the Kiwis Count survey. Steady improvement in satisfaction has occurred over that time, with an average overall service quality score of 72 (out of 100) across the 42 services in the March 2014 quarterly survey.6
Figure 2: Kiwis Count overall service quality scores, March 2014

Source: State Services Commission: Kiwis Count Survey
Some key pressure points
While high performing overall, there are some key pressure points that impact on performance. These pressure points also shone through in the 2013 National Integrity System Assessment for New Zealand. This assessment by Transparency International focused on 12 ‘pillars’ of integrity and while it reinforced many of our strengths, it also highlighted two areas where performance has been consistently weaker:
- The degree of economic inequality that strains social cohesion.
- The interface between central and local government, with concerns about how central government transfers regulatory responsibilities to local government.7
Public services less successful for some parts of society
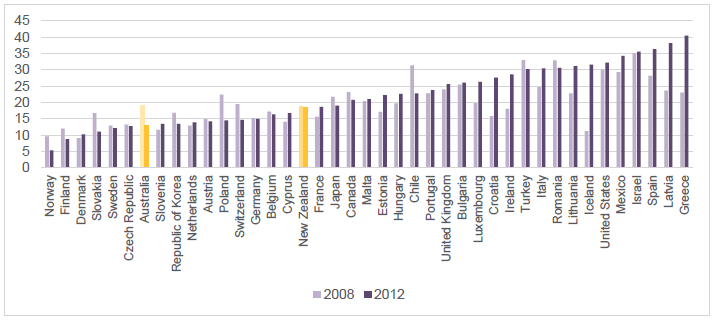
New Zealand has relatively high levels of child poverty, compared to other countries (Figure 4). An important measure of the performance of public services is their ability to mitigate and overcome the impacts of socio-economic disadvantage. Child poverty rates have remained stubbornly high in New Zealand, suggesting the public services have been relatively ineffective at reducing the incidence of child poverty. In addition, the impact of poverty appears to be persistent, over time and across generations.
Figure 3: Child poverty rates

Source: UNICEF (using a number of data sources)
Social mobility has been an important focus for many countries – designing policies to reduce the barriers to mobility, so that poverty and disadvantage are less persistent across generations. There is limited information on social mobility, however New Zealand appears to be around the middle of the OECD for the persistence of disadvantage across generations.8 OECD analysis also shows that educational achievement in New Zealand is more closely linked to economic and social factors such as parental education and skills than in many other countries. Table 2 highlights the large gap in educational performance that occurs across socio-economic groups in New Zealand.
Table 2: Education socio-economic indicators
| Indicators | Ranking (among 34 OECD countries) |
|---|---|
| Maths performance difference across socio-economic groups | 31 |
| Reading performance difference across socio-economic groups | 31 |
| Science performance difference across socio-economic groups | 31 |
| Resilient students – proportion of disadvantaged students performing in the top 25% | 24 |
Source: OECD, 2012
The education system’s poorer performance for children living in poverty, Māori, Pasifika and children with special education needs is well-documented and has proved difficult to resolve. Educational achievement is consistently lower for children and young people from these backgrounds, including on all three of the Better Public Services results for education.9 This can be seen in Table 3 which sets out performance against Better Public Service education targets 2 and 5.
Table 3: Performance against Better Public Service targets 2 and 5
| Actual performance | Target performance | |||
|---|---|---|---|---|
| 2012/13 | 2013/14 | 2013/14 | ||
| Target: In 2016, 98% of children starting school will have participated in quality early childhood education | ||||
| Measure: percentage of children who have attended early childhood education prior to starting school | All | 95.6% | 95.9% | 96% |
| Māori | 92.3% | 92.9% | 94% | |
| Pasifika | 88.6% | 90.3% | 92% | |
| Decile 1-3 School Students | 90.4% | 91.6% | 93% | |
| For financial years ending June | ||||
| Target: 85% of 18-year-olds will have achieved NCEA Level 2 or an equivalent qualification in 2017 | ||||
| Measure: percentage of 18-year-olds with NCEA Level 2 or an equivalent qualification | All | 77.2% | 78.6% | 77.9% |
| Māori | 60.9% | 63.3% | 66.4% | |
| Pasifika | 68.1% | 71.4% | 72.0% | |
| For academic years ending December | ||||
Source: Ministry of Education, 2014
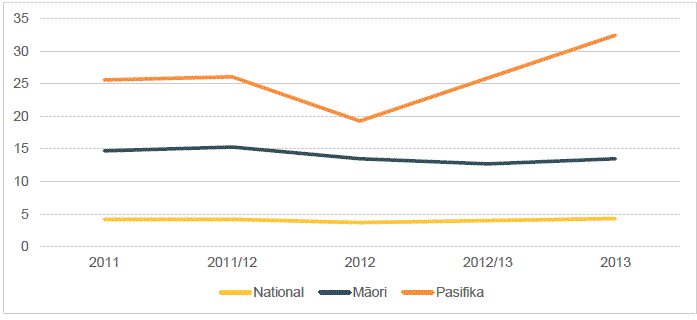
Similarly, health outcomes are also persistently poorer for children in lower socio-economic communities. For example, rheumatic fever rates in New Zealand are much higher than in other developed countries with Māori and Pasifika having a much higher incidence rate per 100,000 (shown in Figure 4).10 Similarly, infant mortality rates are much higher among Māori and Pasifika (shown in Figure 5).
Figure 4: First episode rheumatic fever hospitalisation rate (per 100,000 total population)

Figure 5: Infant mortality rate (deaths per 1,000 live births)

Interface between central and local government
In its inquiry into opportunities to improve local government regulatory performance, the Productivity Commission identified a number of weaknesses, including:
- That central government accountability is weakened when the implementation of regulatory functions is decentralised, and that this ‘accountability disconnect’ weakens incentives on central government to undertake rigorous analysis when designing regulations.
- That there is insufficient analysis of local government’s capability or capacity to implement regulation prior to devolving or delegating additional regulatory functions, or making changes to existing functions.
- Engagement with the local government sector is generally poor and, as such, is undermining the quality of local regulation.
- Regulatory assurance processes (Regulatory Impact Statement requirements) are seen as an ‘administrative hurdle’ rather than an integral part of the policy process.11
These findings are supported by findings coming through Kiwis Count data where the lowest satisfaction scores are for services designed by central government and delivered by local government – specifically environmental management, building consent and local roads.
The National Integrity System Assessment identified an ‘apparent absence’ of clear and agreed principles governing the relationships between central and local government. Their observation was that in practice the governing principle is ‘local government is free to take decisions – as long as central government does not disagree’.12
1: Twelve pillars are: Institutions; Infrastructure; Macroeconomic environment; Health and primary education; Higher education and training; Goods market efficiency; Labour market efficiency; Financial market development; Technological readiness; Market size; Business sophistication; Innovation.
2: World Economic Forum, 2014.
3: ibid.
4: The World Bank Group, 2014
5: Potential years of life lost is a measure of premature mortality
6: State Services Commission, 2014
7: Transparency International New Zealand, 2013
8: The Treasury, 2010
9: Ministry of Education, 2014
10: Ministry of Health, 2014
11: The Productivity Commission, 2013
12: Transparency International New Zealand, 2013
