Changing landscape
There are a number of global and domestic trends that are reshaping the context within which public services are delivered in New Zealand and which will affect how well New Zealand public services perform. We have synthesised several recent environmental scans13 and applied them to New Zealand’s circumstances and context, to identify the most significant trends:
- Ageing population
- Shifts of population into cities and declines in other areas
- Increasing diversity
- Disruptive technology
- Increasing citizen expectations
- Fiscal constraints.
Ageing population
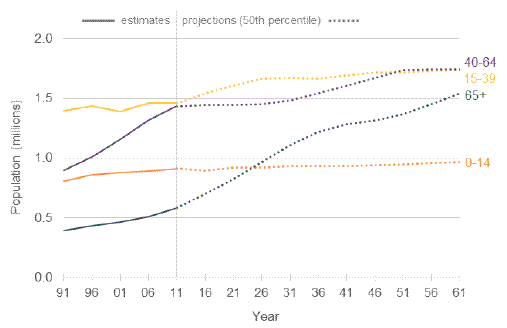
Population ageing is not a new trend – the average age of New Zealand’s population has been gradually increasing for over a century, with a growing proportion of older people. Ageing populations are also a global challenge. Currently, New Zealand’s population is relatively youthful with 14.2 percent of the population aged 65+ in 2013 (compared to an average of 16.8 percent across all developed countries). However, as Figure 6 illustrates, the proportion of the population 65+ will rise, reaching around 21 percent by 2031 and around 26 percent by 2061.14
Figure 6: Change in age group numbers
Source: Statistics New Zealand - population estimates and projections (1991-2061)
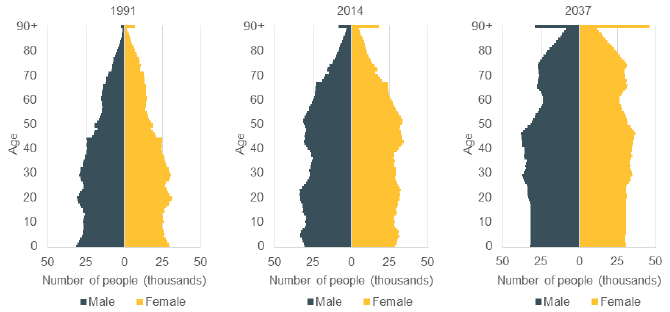
This ageing population is being driven by declines in birth rates and increasing life expectancy. The impact is also exacerbated by a relatively large post-war generation (the “baby boomers”) born between 1945 and 1965.15 With more people living longer there will be more elderly aged 65+ than children 0-14 years within 12 years.
Figure 7: Age population pyramids (23 years apart)
Source: Statistics New Zealand - population estimates (1991 and 2014) and projections (2037)
An older population impacts on a range of public services. As people age, more people live longer with chronic health conditions and the demand for health services rise. Governments will also be expected to spend more on superannuation and social support care (such as home-based support services and aged residential care). Spending on other services may need to decrease.16
The change also impacts on the average family size and demand for housing types with more households without children (both couple-only and single-person).
Shift of population from provinces to cities
Alongside an ageing population, public services need to respond to a shift in population from provinces to cities. As the demographic makeup of this population shift will vary, it will result in some areas being more affected by population ageing.
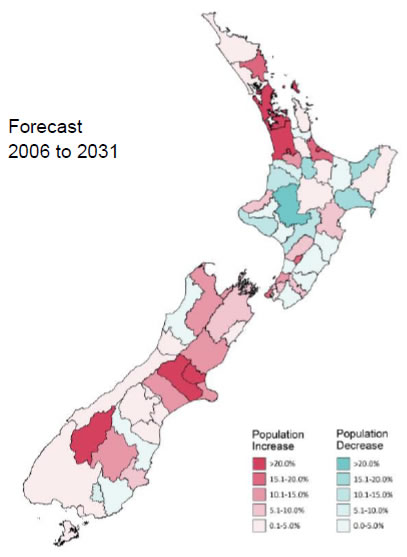
Over the past two decades, significant growth in the overall New Zealand population has been accompanied by that growth being concentrated in Auckland and, to a lesser extent, other cities. Most of New Zealand has seen little or no growth in the local population, and between a quarter and a third of councils have seen absolute declines in population. The areas in decline are generally provincial, rural communities with small towns.17
As Figure 8 illustrates, this pattern of uneven population growth is projected to continue and become more pronounced by 2031.
Figure 8: Change in Population by Territorial Local Authority
Source: Statistics New Zealand – Census data 2006, 2013; and
Projected population of Territorial Authority areas, 2006-31 (2006 base, October 2012 update) – medium series
Ageing provinces
As Table 4 shows, between 2011 and 2031, 56 (84 percent) of the 67 territorial local authorities will experience a doubling or more of their 65+ population. In contrast, a small number of cities – including Auckland, Hamilton, Queenstown, Wellington, Tauranga and Greater Christchurch – see much lower rates of growth in the share of the 65+ population.
Table 4: Population Ageing by Territorial Local Authorities
| Cities/Districts | Percentage growth in those aged 65+ (2011-2031) |
|---|---|
| Auckland, Hamilton City, Queenstown-Lakes District | 36-37% |
| Tauranga City, Wellington City, Selwyn District | 44-46% |
| Waikato District, Palmerston North City, Waimakariri District | 60-63% |
| Whangārei District, Christchurch City | 95% |
| All other 56 territorial local authorities | 100%+ |
Source: (Jackson, 2013, p.24)
Local authorities experiencing declining and ageing populations face the challenging combination of a reducing rating base at the same time as the costs of specialist expertise and service provision are increasing.18 Reducing costs and providing better value in terms of customer service are key drivers for several neighbouring local authorities exploring greater use of shared services.19 Demand for change is also behind proposals for amalgamations of local authorities and the creation of unitary authorities.
In contrast, local authorities experiencing increasing populations face demand for infrastructure (including to support new housing development), social services (arts, sports, and recreation), the environment (regulatory policies and processing, parks) and other matters (crime and alcohol trading). These local authorities can struggle with these demands and balancing these costs across existing ratepayers and new ratepayers (including through development contributions). It also impacts on central government with planning and delivery for schools, tertiary institutes, hospitals, police, corrections, child/youth/family, work and income.
Increasing diversity
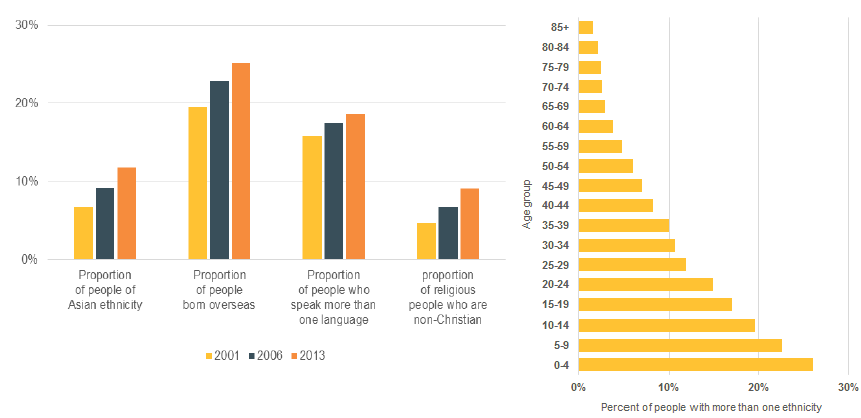
New Zealand has some of the highest rates of migration in the OECD – with high levels of immigration and emigration. Around a quarter of the New Zealand population was born overseas. This proportion has been increasing over time and is projected to continue to increase. This migration is also driving an increasingly diverse population from a growing range of backgrounds and cultures. In particular, the share of the population that is of Asian ethnicities in growing strongly and is projected to continue growing (Figure 9).
Figure 9: Increasing diversity of the New Zealand population
Source: Statistics New Zealand - Census 2013
Auckland diversity
This diversity is and will be most pronounced in Auckland. This diversity comes through in a number of indicators, including whether someone identifies with more than one ethnic group. Young people are also more likely to identify with more than one ethnic group and this will contribute to overall diversity over time.
While the majority of Auckland’s population is currently NZ-European (59.3%), this is much lower than for New Zealand as a whole (74%) and is projected to become the minority by 2031. Auckland is home to a higher proportion of the population born overseas – with almost 40% of Auckland’s population in 2013 born overseas. Auckland also has much higher proportions of residents of Pasifika and Asian ethnicities – almost a quarter of the Auckland population is of Asian ethnicities, and around 15% are Pasifika (Figure 10).
Figure 10: Auckland’s diverse population
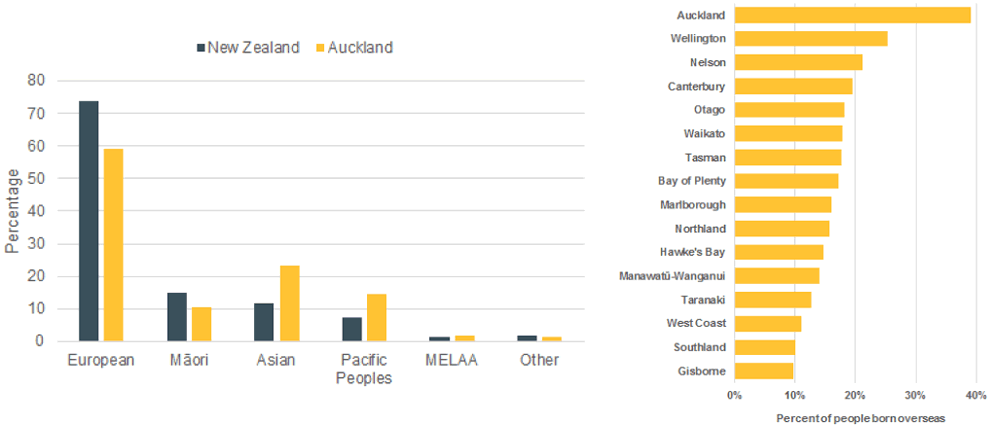
Source: Statistics New Zealand – Census 2013
While ethnic groups are spread throughout the region, there are concentrations in some areas.20 As diversity increases and it becomes more concentrated in particular areas, the means of delivering services needs to adjust. There is already substantial demand in Auckland for both speakers and interpreters of different languages. In the healthcare sector, cultural competency training is a growing part of workforce requirements. For example, the Ministry of Health has published a handbook for health professionals on Refugee Health Care to ensure the delivery of services that are culturally, linguistically and religiously appropriate to refugee communities.21
Figure 11: Numbers of overseas born by area of birth, Auckland region, 2006 and 2013
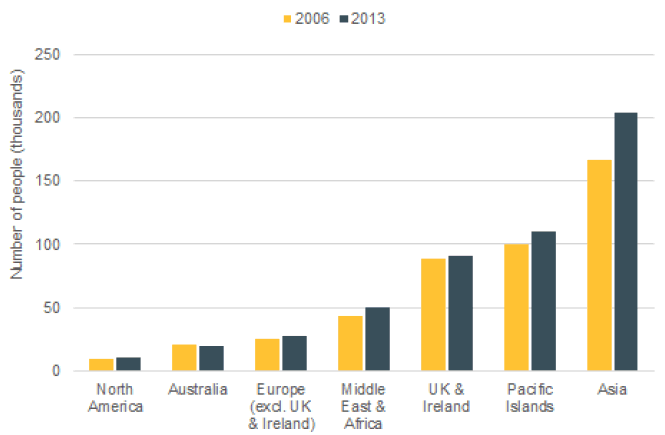
Source: Statistics New Zealand - Census data
Disruptive technology
“Disruptive technology”22 is a phrase designed to reflect the way that the latest generation of web technologies in particular (broadly, on-line transactions and social media) can significantly disrupt traditional business models. In particular, technology provides potential for more efficient transactional services for citizens – through the migration from face-to-face to phone- and web-based services – and for citizens themselves to be more active participants in public services. This also demands a significant shift from government agencies as it places greater emphasis on the ‘outside-in, wisdom of crowds approach’ rather than the ‘inside-out, authoritative know-all approach’ that has been more traditional in public services.23
Generally, government agencies have been slow adopters of technology when compared to the private sector – reflecting both a degree of risk-aversion and the absence of the competitive forces that drive the growth, decline, entry and exit of commercial providers. Government agencies are often designed (and defined) around the delivery of a particular public service, and they may find it difficult to reinvent themselves to achieve outcomes in new or different ways. Over the last 25 years, slow adoption of new technologies by government agencies has arguably contributed to a widening productivity gap between public and private sectors.24
This slow rate of adoption was observed in the Office of the Auditor General’s inquiry into the use of social media within the New Zealand public service that highlighted moves to embrace this new technology as cautious but positive.25
Cautiousness to adopt new technology is not trivial and commissioning such projects brings its own set of challenges (for example, ensuring coverage and adequate support for clients). Government agencies’ lack of skill and experience in commissioning big IT projects in particulars has had significant consequences. Most recently, the challenges in implementing Novopay undermined public trust and confidence in the Ministry of Education and the public sector more widely – reflecting a number of shortcomings, including an inadequate approach to procurement that failed to appreciate the complexity of the required solution.26
Better Public Services results 9 and 10 focus on sharing expertise across government in ICT solutions to improve interactions with government for businesses and individuals. Together with the functional leadership being provided by the Government Chief Information Officer, they are focused on enabling government to make better use of technology. Some of the benefits of this approach include harnessing economies of scale across agencies (similar to the use of public sector anchor customers to support the role out of ultra-fast broadband), developing scarce expertise for the benefit of the systems and supporting the development of consistent interfaces with government for citizens and businesses.27
Citizen expectations
The increasing rate of change resulting from technology goes hand in hand with increasing citizen expectations, with citizens increasingly having the information to compare and challenge the quality and performance of public services. For example, comparing published data on performance of schools or hospitals – both to choose within their locality and to inform their level of expectations. How citizens behave as citizens is also increasingly influenced by their experiences as consumers. Citizens as consumers expect:
- quicker, more responsive and individualised services
- greater ownership, control and voice
- higher performance, quality and standards.
These changing expectations can be seen in particular among the younger generations. Research into satisfaction in public service highlights that younger people have a stronger preference for online service delivery and that school-aged students place a premium on respect. Younger generations (and the Asian population) also place strong importance on speed of service.28
A scan by the United Nations Development Programme of trends, challenges and opportunities relating to public service reforms in both the developed and developing world found that governments are needing to respond not only to a changing environment but a more active citizenry. In particular, wider use of the internet has made citizens more aware and impatient, putting public servants under greater scrutiny.29
In the United States, for example, demand for much greater transparency is driving the ‘Open Government Partnership’ where the current administration has a National Action Plan to increase citizen participation, collaboration and transparency in government. At a high level, the action plan aims to:
- increase public integrity
- increase transparency around resource management, improving the effectiveness of management
- improve public services, including through further expansion of public participation in the development of regulations and open data to the public.30
With increasing diversity within the New Zealand population, we should expect both rising citizen expectations and also an increasing variety of citizen expectations. For example, we should expect that the elderly in provincial New Zealand will have different expectations of local and central government compared with youth in larger cities. Delivering on these different expectations will require different capabilities and operating models, especially within local government. With population trends, provincial councils in particular will face increasing challenge in delivering on expectations.
Fiscal constraints
While the fiscal impact of the Global Financial Crisis varied between countries, its impact on the direction of public administration globally is undoubtable as countries respond to the need to deal with the challenging goals of both improving (or maintaining) public services while also cutting costs and reducing overall expenditure and debt.31
Projected growth in government spending puts increasing fiscal constraint into perspective. The Treasury projects that, by 2060, government spending on healthcare will grow from 6.8 percent of GDP in 2010 to 10.8 percent and that spending on NZ Superannuation will grow from 4.3 percent of GDP in 2010 to 7.9 percent.
These projections assume that policy settings remain largely unchanged and that government expenses follow average historic rates of growth and result in government spending approaching 50 percent of GDP and rising debt. The implication is that policy settings will need to be adjusted to bring spending back to a more sustainable share of the economy – emphasising that there are enduring, longer term fiscal constraints that will continue to apply pressure to the public services, in addition to the more recent pressures of the last six years.
Figure 12: Treasury projections for government expenses, revenue and debt as percent of nominal GDP under the 'Resume Historic Cost Growth' scenario
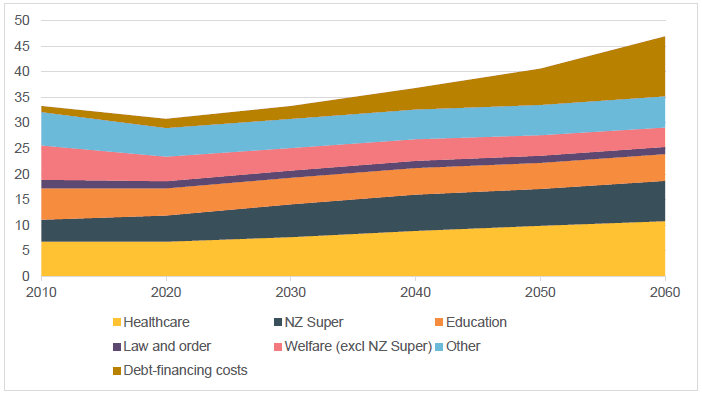
Source: Treasury
13: Various sources including KPMG (2013), McKinsey (2007) and PricewaterhouseCoopers (2013)
14: Jackson et al., 2014
15: The Treasury, 2013
16: Office of the Auditor-General, 2014
17: Jackson et al., 2014
18: New Zealand Productivity Commission, 2013
19: ALGIM, 2010
20: Spoonley, 2013
21: Ministry of Health, 2012
22: Bower and Christensen, 1995
23: Chun et al., 2010
24: Eggers & Jaffe, 2013
25: Office of the Auditor-General, 2013
26: Ministerial Inquiry into the Novopay Project, 2013
27: New Zealand Government, 2011
28: State Services Commission, 2008
29: UNDP, 2013
30: U.S. Government, 2013
31: Curry, 2014
