Part 9: Performance measures and targets for reducing reoffending
9.1
In this Part, we discuss the Department's performance measures and targets, and how the Department monitors and reviews performance information.
Summary of our findings
9.2
The Department has clear performance measures and targets for reducing reoffending that are in line with its strategic priority. The Department has set a target to reduce reoffending by 25% by 2017. This would see the reimprisonment rate of offenders reduce from 27.1% to 20.3% and the reconviction rate of community-based offenders reduce from 30.4% to 22.8%. The Department calculates that this will mean 4600 fewer offenders each year by 2017.
9.3
The reducing reoffending rate reported by the Department includes prisoners reconvicted and sent back to prison, but it does not include prisoners who have been reconvicted and have received a community-based sentence.
9.4
The June 2013 results show that the reimprisonment rate of offenders is 26.7% and that the reconviction rate of community-based offenders is 26.8%. These are the lowest reoffending rates in the last 10 years.
9.5
We tested the Department's performance measures and targets to see whether it was possible for it to manipulate results. On the balance of what we have seen, we conclude that the decreasing reoffending rates are a result of the Department's practices and improved management of offenders.
9.6
The Department collects good management information on prisons' performance. There is an opportunity to publish the reoffending rates at a prison level to show how each prison contributes to the Department's overall strategic goal to reduce reoffending.
Performance measures and targets
9.7
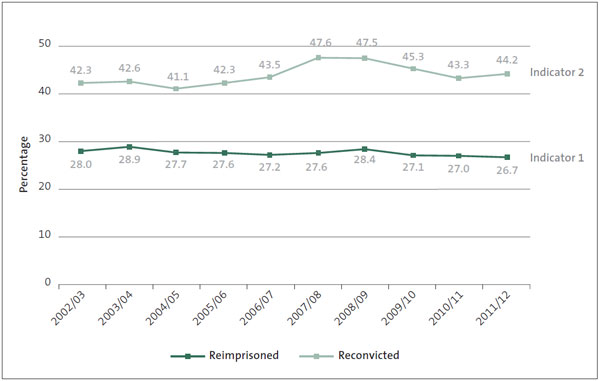
The Department has reported reoffending rates in its annual report for more than a decade. The recidivism index6 shows the four main indicators used to measure reoffending rates. They are the percentage of:
- prisoners who are reimprisoned within 12 months of release (indicator 1);
- prisoners who are reconvicted within 12 months of release (indicator 2);
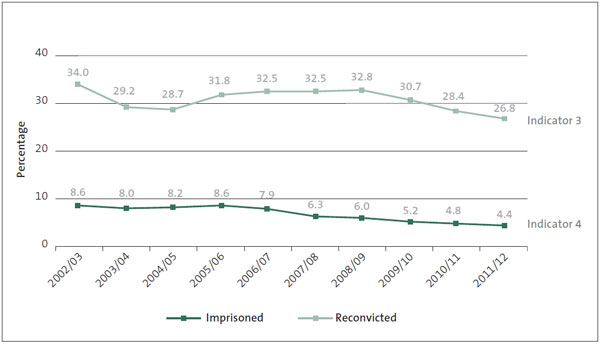
- offenders serving a community-based sentence who are reconvicted within 12 months of beginning their sentence (indicator 3); and
- offenders serving a community-based sentence who are imprisoned within 12 months of beginning their sentence (indicator 4).
9.8
The four indicators are shown in Figure 9 and Figure 10.
Figure 9
Reconviction and reimprisonment rates for offenders released from prison, within 12 months of release

Source: Department of Corrections.
Figure 10
Reconviction and imprisonment rates for offenders serving a community-based sentence, within 12 months of beginning their sentence

Source: Department of Corrections.
9.9
Some people believe that 12 months is too short a measurement period and that five years would better represent results. However, the Department maintains that more than half of all offenders who are reimprisoned after they are released are returned to the prison within 12 months. We note that 12 months after release appears to be the international standard measure. We also note that the Department's annual reports include reconviction and reimprisonment rates for 12 and 24 months. (Appendix 3 shows recidivism rates within 24 months.)
Reducing reoffending by 25% by 2017
9.10
Reconviction rates are the most widely used method of measuring reoffending. Reconviction figures include imprisonments and community-based sentences. For the target of reducing reoffending by 25% by 2017, the Department reports on indicators 1 and 3, as shown in Figures 9 and 10.
9.11
Indicators 2 and 4 measure the seriousness of offending in comparison to previous offending. For example, if a released prisoner is reconvicted but not imprisoned, their offending is considered less serious. Conversely, if an offender serving a community-based sentence is reconvicted and imprisoned, their offending is considered more serious. By using indicator 1 and indicator 3 (which includes indicator 4), the Department reports on reoffending that is either as serious as, or more serious than, an offender's previous offences.
9.12
The Department set the baseline for the 2017 target at 30 June 2011 (30.1%). Based on this figure, a 25% reduction in reoffending would see the reimprisonment rate of prisoners reduce from 27.1% to 20.3% and the reconviction rate of community-based offenders reduce from 30.4% to 22.8%. The Department calculates that this will mean 4600 fewer offenders by 2017.
9.13
The results, as at June 2013, show that reimprisonment rate of prisoners is 26.7% and that the reconviction rate of community-based offenders is 26.8%.7 Figure 9 and Figure 10 show that these are the lowest reoffending rates in the last 10 years for the 12-month follow-up period. Figure 11 shows the progress the Department has made to date in achieving its target of reducing reoffending by 25% by 2017.
Figure 11
Progress in reducing reoffending towards 2017 targets
| Period reported | Reimprisonment rate of prisoners % |
Reconviction rate of community-based offenders
%
|
|---|---|---|
| Baseline, in the year to June 2011 | 27.1 | 30.4 |
| Current, in the year to June 2013 | 26.7 | 26.8 |
| Target, for the year to June 2017 | 20.3 | 22.8 |
Source: Ministry of Justice and Department of Corrections.
9.14
So far, the results have come mostly from reducing the reconviction rates of offenders on community-based sentences. This is partly because of a lag in results for prisoners. For example, prisoners need to complete a rehabilitation programme, be released, and then be measured 12 months later. Offenders on community-based sentences are measured from the time they are sentenced, meaning their results are seen sooner.
Risk of the Department manipulating results
9.15
We tested the Department's performance measures and targets to see whether it was possible for the Department to manipulate results.
9.16
The reducing reoffending rate reported by the Department includes prisoners reconvicted and sent back to prison (indicator 1), but it does not include prisoners who have been reconvicted and have received a community-based sentence (indicator 2). In the last 12 months, 1350 prisoners were reconvicted and given a community-based sentence. We checked to see whether excluding this group made the results look better. However, this was not the case because the reconviction rate of prisoners has decreased more than the reimprisonment rate. We note that the June results have shown an upturn in the reconviction rate of prisoners but that, during the past four years, the overall trend is downwards.
9.17
However, not using the overall reconviction rate for all offenders as part of the Department's reporting for reducing reoffending by 25% can make the results more difficult to understand and could detract from the good results that the Department is achieving.
9.18
In our view, the results have come after the successful community probation change programme and after putting the IPF into effect. This includes creating a supportive learning environment, the DRAOR, and the practice centre. These initiatives ensure that the mandatory standards are being met more consistently.
9.19
On the balance of what we have seen and everything the Department has put into practice, our judgement is that the Department's performance results are because it manages offenders better.
Monitoring and reviewing performance information
9.20
The Department has performance measures to assess the performance of prisons and community probation.
9.21
The Department assesses the performance of its prisons against key performance indicators (KPIs). The KPIs measure whether a prison is meeting minimum requirements to be a safe and secure facility. They also measure the rehabilitation performance of the prison. The KPIs are relevant and link to the Department's two strategic priorities of public safety and reducing reoffending.
9.22
Community probation assesses its performance against its mandatory standards. Mandatory standards are unique to each type of order or sentence. For example, one of the 13 mandatory standards probation officers must meet for an offender on parole is to "take action every time the offender does not comply with any requirement of their parole to hold them accountable for compliance with their order". Community probation has a target to consistently achieve 98% of mandatory standards for all sentences and orders. The latest figures show that 94% of mandatory standards were achieved in August 2013.
Measuring and reporting prison performance
9.23
The Department publicly reports each prison's performance through a league table. The purpose of the table is to track the performance of each prison and to allow public and privately operated prisons to be compared.
9.24
There are three measures to work out a prison's overall rating:
- core security indicators, such as escapes, riots, and unnatural deaths – if any of these take place, the prison will be classified as needing improvement, no matter how well it performs in the next two measures;
- internal procedure measures, such as the number of complaints, drug testing results, and assaults – if these do not meet the required standards, the prison will be classified as needing improvement; and
- rehabilitation measures – this includes increasing participation in education or employment programmes.
9.25
Each prison is given a performance grade of Exceptional, Exceeding, Effective, or Needs Improvement, based on the KPIs. The Department weights each KPI to reflect the significance it places on each indicator and the challenges facing each prison, such as prisoner population, prisoner turnover, security classifications, and programmes offered. If the minimum requirements for a safe and secure prison are met, the rehabilitation KPIs become the main driver of which performance grade is awarded.
9.26
The prison performance table is one tool the Department uses to monitor performance against its intended goals. The Department also uses information from the recidivism index to see which prisons contribute the most to reducing reoffending and which have the highest recidivism rates. For example, Hawke's Bay Prison consistently has high reimprisonment rates. Hawke's Bay Prison has a high young Māori male population with high gang affiliation, and the recidivism index shows that these groups have high reoffending rates.
9.27
In our view, the Department collects good management information on prisons' performance. We note that the Department has begun a review of the prison performance table rehabilitation measures, which will result in recommendations for change and add additional KPIs. We suggested to the Department that there is an opportunity for it to also review what performance information about prisons it publishes. We consider that publishing the reoffending rates at a prison level would complement the performance results reported in the league table. This would publicly show how each prison contributes to the Department's overall strategic goal to reduce reoffending.
6: The recidivism index measures the Department's effectiveness in reducing reoffending.
7: The September 2013 results show that the reimprisonment rate of prisoners is 26.2% and the reconviction rate of community-based offenders is 26.6%.
page top
