Part 2: Public assets and the services that they support
2.1
In this Part, we summarise the information we collected about:
and we also classify the assets into the groups of services to which they contribute.
The value of assets
2.2
We know that the public sector has assets valued at more than $225 billion.3 However, for the purpose of this paper, we collected information about the significant assets of more than 340 large public entities. Significant assets are those that are important to an entity in delivering its services. Appendix 1 shows the questions that we asked our auditors to use to collect information.
2.3
The entities we collected information about have significant assets with a total value of about $214 billion, according to their financial statements. We refer to this amount as the carrying value of those assets.
2.4
Appendix 2 shows the number and types of public entities for which we collected asset management information. It also shows the types of public entities excluded from our review because of their smaller size.
2.5
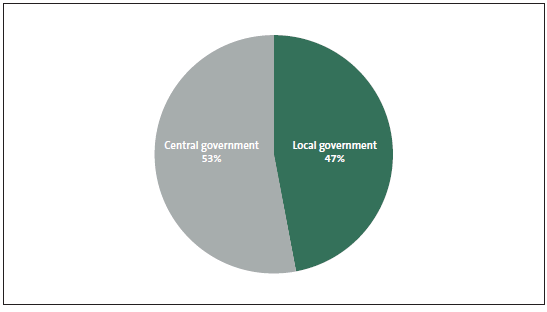
As Figure 1 shows, central government entities have 53% (about $112 billion)4 of these assets and local government entities have 47% (about $102 billion).
Figure 1
Local and central government's shares of public assets

Note: See Appendix 2 for details of the entities we have included in central government and local government.
The types of assets
2.6
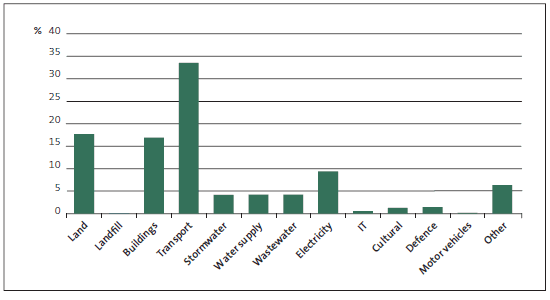
Figure 2 shows that about one-third of the assets are land and buildings, one-third are transport assets, and the remaining one-third are all other types of assets.
Figure 2
Types of public assets, by value

Note: Landfill assets and motor vehicles are both less than 1% of the total assets.
How assets are valued
2.7
Financial reporting standards require assets to be initially measured at cost. After this initial measurement, there is a choice between:
- cost less accumulated depreciation; or
- fair value.
2.8
The information that we collected shows that about 90% of the carrying value of the assets by value is measured using fair value.
2.9
The fair value of assets is calculated based on either market information or, where there is no market information, depreciated replacement cost. Most public assets are specialised in nature, which means that depreciated replacement cost is likely to be used to calculate their fair value.
Classifying assets into groups of services
2.10
We have classified the assets of the large public entities into six groups based on the services those assets contribute to. The groups are:
- economic;
- environmental;
- health;
- educational;
- social, cultural, and heritage; and
- protection and security.
2.11
An individual entity can hold assets that contribute to more than one group. As far as possible, we have included assets in the group to which their purpose most closely relates. For example, a local authority's assets may provide transport (economic group), water supply (health group), and sporting and cultural facilities (social, cultural, and heritage group).
2.12
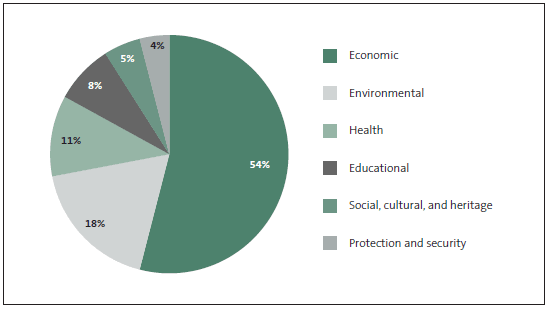
Figure 3 shows the proportion of assets that we allocated to each group.
Figure 3
Public assets grouped by the services they contribute to

Note: The percentages in Figure 3 are based on the carrying value of the $214 billion of public assets for which we collected information.
Economic assets
2.13
Economic assets are those that are important to the economic performance of communities and businesses.
2.14
This group of assets includes transport, electricity generation and distribution, information technology hardware, and other financial or economic assets. It also includes most of the assets of state-owned enterprises, port companies, and airports, as well as those of the Inland Revenue Department and the Ministry of Business, Innovation and Employment.
2.15
The economic group is the largest group, with more than $114 billion of the assets, $72 billion of which are transport assets, and $20 billion of which are electricity generation and distribution assets.
Environmental assets
2.16
Environmental assets include land (including conservation land), stormwater assets, flood protection assets, and landfills.
2.17
Environmental assets total more than $39 billion.
Health assets
2.18
Health assets include the assets of district health boards (DHBs) and their subsidiaries, as well as water supply and sewerage assets.
2.19
Although DHBs provide most health-related services, water and sewage schemes are fundamental to preventing disease in communities.
2.20
Health assets total about $23 billion.
Educational assets
2.21
Educational assets contribute to knowledge and skills. This group of assets includes those that provide educational opportunities and advancement through research.
2.22
This group includes most of the assets of tertiary education institutions and Crown research institutes, as well as those of the Ministry of Education, the Tertiary Education Commission, the Education Review Office, and the New Zealand Qualifications Authority.
2.23
Educational assets total more than $18 billion.
Social, cultural, and heritage assets
2.24
Social, cultural, and heritage assets include social services assets, such as the assets of the Ministry of Social Development, cultural and sporting facilities, and the assets of museums, art galleries, and libraries. Cultural and heritage assets can be difficult to value, and a number of entities that have such assets do not record them in their financial statements.
2.25
Social, cultural, and heritage assets total at least $11 billion, more than $7.5 billion of which are buildings, and more than $2.5 billion of which are cultural assets.
Protection and security assets
2.26
The protection and security of New Zealand and New Zealanders is a core public service. The defence force, police, corrections, and fire and civil defence services contribute to our protection and security.
2.27
This group of assets includes most of the assets of the New Zealand Defence Force, the Department of Corrections, the Ministry of Justice, the New Zealand Fire Service Commission, and the New Zealand Police.5
2.28
Protection and security assets total more than $8 billion.
3: The total of $225 billion was identified in our recent paper Insuring public assets. The figures presented in this paper represent only those assets that we collected asset management information about.
4: This balance includes all assets of the central government entities received through the returns. This is greater than the total included in the Financial Statements of the Government as at 30 June 2012 which does not include the tertiary education institutes that are recognised on an equity basis under NZ IAS 27 and NZ IAS 28.
5: Protection and security assets do not include those of New Zealand Customs and the Ministry of Primary Industries, which are included in the Economic group because of their contribution to the economy.
page top
