Part 3: Effective enforcement
3.1
In this Part, we:
- discuss the complexity of assessing the effectiveness and efficiency of the Police's efforts to enforce drink-driving laws;
- discuss how well the Police report on their performance in enforcing drink-driving laws;
- describe how the New Zealand Transport Agency and the Police plan to better assess and report on effectiveness and efficiency and to get the best value for money from road policing; and
- present some high-level indicators of the effect of enforcement on the incidence of alcohol-impaired driving.
Summary of our findings
3.2
Although we found evidence of positive and encouraging trends, we could neither form a conclusive view on how effectively the Police enforce drink-driving laws nor conclude whether the Police are as efficient as they could be. The information that is available is inadequate. Also, assessing effectiveness and efficiency is complex because the Police's work is part of a system of factors that together affect road safety, and the Police officers devoted to enforcing drink-driving laws are spread throughout units with other responsibilities.
3.3
The Police's current measures are not specific enough to show us the relationship between the investment in enforcing drink-driving laws and the desired outcomes or to form a view about how effectively the Police enforce drink-driving laws.
3.4
We consider that the Police need to improve how they report on their performance. Reporting should be useful to the Police, their road safety partners, the public, and other interested parties. It should show what the Police are achieving and what effect changes in policing and other factors have on the prevalence and effect of drink-driving. To better report on performance, the Police will need to collaborate with the other agencies working to improve road safety.
3.5
The New Zealand Transport Agency and the Police want to improve how they assess and report on how effectively and efficiently they enforce drink-driving laws. Doing so should help them to make better decisions about how much to invest in various activities that aim to improve road safety, including how to enforce drink-driving laws in the most effective and efficient way.
3.6
The Road Policing Programme for 2011/12 details steps the Police are taking that should improve aspects of their reporting. The Police are considering other ways to improve, which need more time to be put into effect. The New Zealand Transport Agency and the Police must identify where they can be more effective and make changes so that enforcement work does more to reduce the number of road deaths and injuries that drink-driving causes.
The complexity of assessing effectiveness and efficiency
3.7
In September 2012, a Performance Improvement Framework (PIF) review of the Police noted the New Zealand Transport Agency's concern that it could not work out whether the amount and pattern of spending was achieving the best results and whether redistributing resources within road policing would achieve better results.6
Assessing how effectively the Police enforce drink-driving laws
3.8
The PIF review found that the Police needed to make road safety programme spending more transparent. The review report said that the Police should prepare regular performance reports that are acceptable to transport agencies and produce analysis that helps the transport sector work out the most effective way to use resources to reduce road trauma. The review report noted that doing this would require much better evidence about the effect of different activities.
3.9
Measuring how effectively the Police enforce drink-driving laws is complex. In many instances, a combination of activities rather than any one specific activity has affected road safety.
3.10
Better understanding of cause-and-effect relationships between activities, behaviours, and results is required to better assess the value of work to enforce drink-driving laws. Better understanding would help the agencies working to improve road safety to decide on the best balance of road safety work, such as breath-testing drivers, raising awareness of the effect of drink-driving through television campaigns and education programmes in schools, improvements to road layout, and eliminating roadside hazards.
Assessing how efficiently the Police enforce drink-driving laws
3.11
Although our audit focused on effectiveness, where we could, we formed a view on how efficiently the Police enforce drink-driving laws. When observing the Police at work, we saw efficient and less efficient practices. When appropriate, we comment on the efficiency of the work that we observed.
3.12
We looked at trends in some obvious indicators of efficiency, such as how many breath tests each officer carries out. However, we did not consider these indicators sophisticated enough to form a view about the overall efficiency of drink-driving law enforcement work.
Shortfalls in the Police's performance reporting
3.13
Our review of the Police's annual reports from 1989/90 to 2010/11 showed inconsistency in the measures of effectiveness that the Police report from year to year. For example:
- From 1999/00 to 2001/02, and from 2006/07 to 2009/10, the Police reported information about road deaths involving alcohol. The descriptions were worded differently in these years.
- From 2002/03 to 2005/06, the Police did not report any information about road deaths involving alcohol.
3.14
The Police's annual report for 2010/11 describes the focus the Police have given to Safer Journeys and putting into effect a safe-system approach. It sets out information about road crash casualties, population, and vehicle fleet compared with 2001. The information allows deaths and injuries to be viewed within the context of growth in the population and vehicle fleet.
3.15
Nationally, the Police monitor and report how much compulsory and mobile breath-testing they carry out. The Police and New Zealand Transport Agency decide how much breath-testing will be carried out each year. The Police told us that this number is based on population. The Police's annual report for 2010/11 stated that all strategic road policing was in line with Risk Targeted Patrol Plans with regard to the "fatal five" (see paragraph 1.16).
3.16
Reporting breath-testing numbers gives some assurance that output targets have been met (and exceeded in 2010/11). However, it does not give assurance about quality (how much Police operations target risks or how efficiently the Police carry out tests). The numbers do not provide enough context or analysis to form a view about how much enforcing drink-driving laws has helped to reduce the number of deaths and injuries.
3.17
A peer assessment of the Police, which German and Australian police officers carried out in 2009, supports our view.7 The peer assessment report described how any integrated planning framework should ensure that services focus on achieving key goals and objectives, in the end contributing to outcomes. The report said that the New Zealand model did not encourage such a focus.
3.18
Without measuring input or effort (such as full-time equivalent hours spent testing) required to do tests to compare with the number of tests carried out, counting the number of breath tests alone does not measure efficiency adequately.
Improving effectiveness and efficiency
3.19
The New Zealand Transport Agency and the Police have identified some ways to better assess and report on how effectively and efficiently the Police enforce drink-driving laws, and help decision-making about getting the best value for money from the investment in road policing.
The 2012-15 Road Policing Programme
3.20
The Road Policing Programme for 2012-15 set out revised monitoring and reporting requirements for all road policing work that the New Zealand Transport Agency and the Police agreed to. The revisions signal a move towards more focus on outcomes and away from focusing only on the number of breath tests to measure performance.
3.21
To help to measure how much the Police contribute to road safety outcomes, the Road Policing Programme for 2012-15 describes key results to which the Police will contribute significantly. The percentage of people surveyed who think there is a high probability of being stopped at a CBT checkpoint is used to gauge how much enforcing drink-driving laws contributes to the desired outcomes. The Road Policing Programme set baseline data against which progress can be measured.
3.22
The New Zealand Transport Agency will use the survey information to track trends in public perception to help assess the effect of road policing.
3.23
As well as more outcome-focused reporting, the Road Policing Programme for 2012-15 introduced improvement initiatives for the Police, to support effective and efficient road policing.
3.24
The Police will benchmark activity and performance to allow comparisons with other jurisdictions (such as Australia). This is intended to improve understanding of the factors that push costs up and provide a quality assurance tool for reviewing the efficiency of the Police's work. The Police intend to prepare and introduce an "intervention logic framework" to bring about more transparent decision-making and support continuous reviews of road policing. Other initiatives involve investing in technology and improving the profile information about drink drivers, to improve the quality of intelligence and targeting to risk.
3.25
The New Zealand Transport Agency told us that it expects the combination of outcomes-based reporting and the improvements to allow it to better assess the effectiveness of what the Police do will help it to form more conclusive views about road policing's value for money. Between 2012 and 2015, the Police will introduce revised monitoring and reporting requirements and improvement initiatives.
Other planned improvements
3.26
The Police acknowledge the need to better understand how much their enforcing of drink-driving laws contributes to changed public perceptions, attitudes and behaviours, and reduced fatalities and injuries caused by alcohol-impaired driving. A better understanding would help the Police to make better decisions about where to do the most work in road safety, including enforcing drink-driving law in the most effective and efficient way.
3.27
On 1 October 2012, a new National Road Policing Manager took up his post. He told us that his priorities so far include:
- carrying out a stock take of resources and funding for road policing to better assess how capable the Police are to bring about the expected road policing outcomes this stock-take is under way;
- improving the use of intelligence and analysis nationally to help with road policing tactics (see paragraph 4.17);
- increasing the Police's understanding of relationships between enforcing drink-driving laws, changes in driver behaviour, and road safety outcomes and use this to better enforce drink-driving laws;
- benchmarking road policing activity and performance (see paragraph 3.24); and
- working more with educators, high-risk communities, and the public through the media to raise awareness of road safety and to promote behavioural change.
High-level indicators of effectiveness
3.28
We looked at trends in three indicators relevant to alcohol- and drug-driving, as identified in Safer Journeys. These are:
- fatal and serious injury crashes involving alcohol-impaired drivers;
- public attitudes to alcohol and driving; and
- the number of drink-driving offences detected.
3.29
We compared trends in these indicators with trends in the number of breath tests carried out.
3.30
Enforcing drink-driving laws is only one factor contributing to the trends, and we are unable to quantify the precise effect of enforcement. Other activities, such as advertising, building safer roads, running education and advertising campaigns, and legislative change have also contributed. However, research has shown that breath-testing is the most effective way to deter drink-driving. We do not consider the information in paragraphs 3.31-3.41 to be conclusive evidence of performance.
Alcohol-related fatal and serious injury crashes as an indicator of effectiveness
3.31
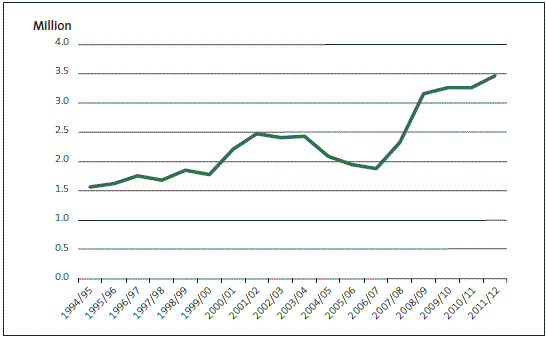
We compared data on crashes involving deaths or serious injuries where alcohol was a contributing factor with the number of breath tests each year between 1994 and 2011 (see Figures 2 and 3).
Figure 2
Number of breath tests carried out, 1994/95 to 2011/12

Source: New Zealand Police and the Ministry of Transport.
Figure 3
Fatal and serious-injury road crashes involving alcohol, 1994 to 2011

Source: New Zealand Police and the Ministry of Transport.
3.32
Although there is no strong statistical correlation, our comparison showed that some trends in the figures for alcohol-related crashes seemed to follow trends in the number of breath tests. Between 1994 and 2001 and between 2008 and 2011, when the Police increased the number of breath tests they carried out, the number of alcohol-related crashes decreased. Between 2004 and 2007, when the number of breath tests decreased, the number of alcohol-related crashes increased.
Public perceptions of drink-driving enforcement as an indicator of effectiveness
3.33
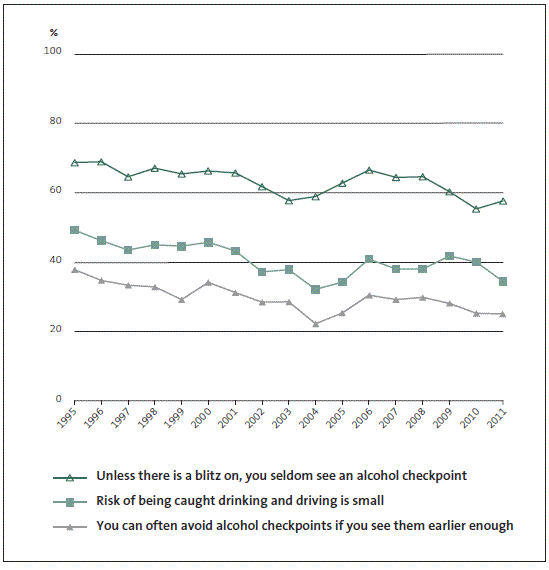
Public attitudes towards drink-driving enforcement appear to have changed in line with changes in the number of roadside breath tests. Figure 4 shows that, between 1995 and 2004 (when, as Figure 2 shows, the number of breath tests was increasing), the public's perception of the effectiveness of drink-driving enforcement improved.
3.34
From 2004 to 2006 when the number of breath tests was decreasing the public perceived enforcement to be less effective. From 2008 to 2011, when the number of roadside breath tests increased, New Zealanders perceived enforcement to be more effective.
Figure 4
Public attitudes to how effectively the Police enforce drink-driving laws, 1995 to 2011

Source: Ministry of Transport (2011), Public Attitudes to Road Safety Survey. Note: In this figure, a downward trend represents improved public attitudes to road safety.
Drink-driving offences as an indicator of effectiveness
3.35
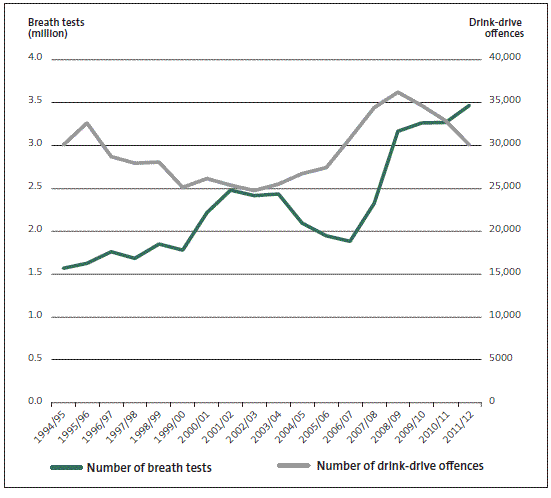
In 2011/12, the number of breath tests carried out was 121% higher than in 1994/95. Despite significantly more tests, the number of offences detected in 2011/12 (30,058) is nearly the same as the number detected in 1994/5 (30,078). However, during this period, the number of offences detected and the number of breath tests fluctuated (see Figure 5).
Figure 5
Number of drink-driving offences and the number of breath tests, 1994/95 to 2011/12

Source: New Zealand Police.
3.36
Between 1994/95 and 1999/00, when the number of breath tests increased, the number of offences detected decreased. Between 2003/04 and 2006/07, when the number of breath tests decreased, the number of offences increased to 31,053.
3.37
The number of breath tests increased significantly between 2006/07 (1.9 million) and 2008/09 (3.2 million), and the number of offences detected continued to increase. There were 36,199 offences detected in 2008/09, the most in any year during the period in review. However, since 2009/10, the number of offences detected has steadily decreased to 30,058 in 2011/12, when 3.5 million breath tests were carried out.
3.38
We looked at whether the way in which the Police tested drivers influenced these changes. For example, the Police could carry out high-volume testing on main roads during the day at times when drivers are less likely to be drinking. This could create a distorted impression of offences reducing because of effective enforcement. However, the Police's enforcement methods have remained relatively consistent over time.
Our conclusions about the effectiveness of enforcement
3.39
Assessing how effectively the Police enforce drink-driving laws is complicated. Recent road safety outcomes have improved significantly, but it is too soon to tell whether the road toll will remain low. We could not work out the extent to which the enforcing of drink-driving laws has contributed to the improved results.
3.40
We did not have enough information to be sure whether the Police enforce drink-driving laws as effectively as they could. We know that some changes in public attitudes and in the number of drink-driving crashes and drink-driving offences that the Police detect seem to follow changes in the number of breath tests.
3.41
When considered together, the information suggests that the Police's enforcement work has a positive effect on road safety. However, we could not see a strong cause-and-effect relationship. Other variables that could have an effect include education campaigns, road engineering changes, and improvements in vehicle safety. Law changes (such as lowering the legal age for buying alcohol from 20 to 18 in 1999) might also have affected drivers' behaviour.
3.42
The Police try to be efficient in their use of time (for example, when they stop drivers to test their breath, they also check the driver's licence and the vehicle's registration). At checkpoints, Police officers detect and deal with many traffic infringements that are not related to alcohol (see paragraph 6.12). However, because the available information is inadequate, we could not form a view on whether the Police are as efficient as possible.
3.43
The Police are seeking to improve how they assess and report on how effectively and efficiently they enforce drink-driving laws. This should help the New Zealand Transport Agency to decide how much to invest in various road safety activities. The initiatives discussed in paragraphs 3.20-3.25 need more time to be put into effect.
3.44
Public reporting should be useful to the Police and their road safety partners, the public, and other interested parties. Reporting should show what the Police are achieving and what effect changes in policing and other factors have on the prevalence and effect of drink-driving. The shared nature of road safety work means that there are benefits in the Police collaborating with other agencies working to improve road safety to consider the most appropriate way to report performance to different audiences.
| Recommendation |
|---|
The New Zealand Police need to improve how they assess how effectively and efficiently they enforce drink-driving laws. We recommend that the Police decide on a consistent and clear set of national indicators to measure how effectively and efficiently they enforce drink-driving laws and:
|

