Appendix 1: Drink-driving statistics
Drink-driving increases the risk of causing a road crash. The degree of risk varies with age and other factors, including how often the person drinks, their height, weight, and gender.
Young drink drivers have a higher risk of crashing. Figure 7 shows that a driver aged between 15 and 19 is about 87 times more likely to crash when at the legal drink-driving limit for an adult (a blood-alcohol concentration of 80mg/100ml) compared to a sober adult aged at least 30. By comparison, a driver aged 40 who has reached the legal drink-driving limit for an adult is about 16 times as likely to crash as if they had no alcohol in their blood.
Figure 7
Relative risk of a fatal crash, by age and blood-alcohol level
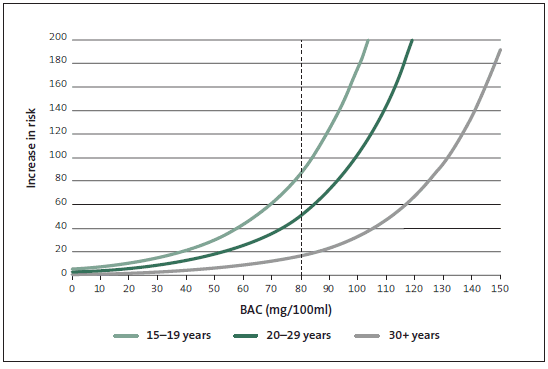
Source: Ministry of Transport, Alcohol/Drugs crash statistics for the year ended 31 December 2010.
Young drink drivers cause more crashes than older drivers. In 2011, 49% of drivers at fault in alcohol- and drug-related crashes were under the age of 25 years, and 20% were aged 15-19 years (see Figure 8).
Figure 8
Crashes where alcohol or drugs were a contributing factor, by age of at-fault driver
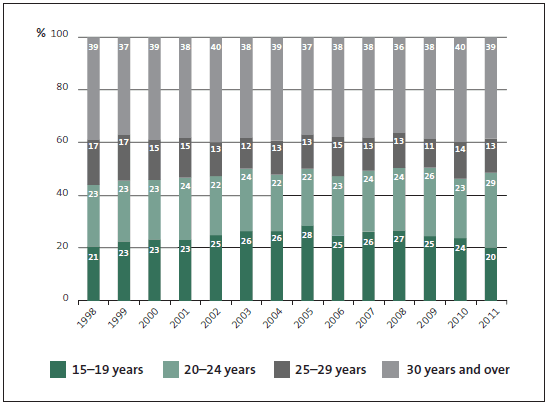
Source: Ministry of Transport.
In 2010, 76% of the drink drivers were men. Between 2008 and 2010, 83% of drivers involved in fatal alcohol- and drug-related crashes were men. Figure 9 shows that young men made up the largest group of drink-driving offenders in 2010.
Figure 9
Number, age, and gender of drink-drivers, 2011
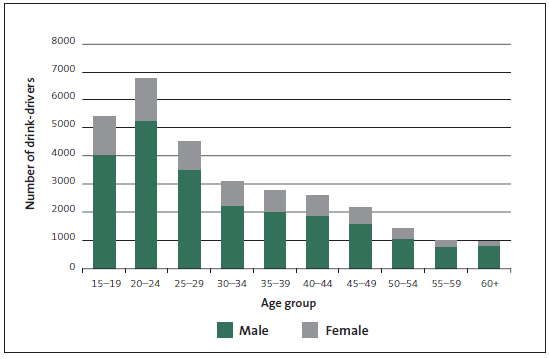
Source: Ministry of Transport, Report on motor vehicle crashes in New Zealand 2011.
However, Figure 9 also shows that men and women in all age groups drink and drive to some extent. Police officers told us that drink drivers are not necessarily community "outsiders" or a small group of known offenders. Instead, many drink drivers are middle-class, middle-aged, citizens. From an enforcement point of view, Police officers consider it just as important to test the breath of someone driving a well-maintained new vehicle as to test the breath of a driver with an older and less-well-maintained car.
Other methods to deter drink-driving and reduce crashes, deaths, and serious injuries
Enforcement by the Police is one way to achieve improved drink-driving outcomes. Other methods include engineering to make roads safer and running education programmes to change driver behaviour.
Ideally, to achieve the best results and change driver behaviour towards drink-driving, strong legislation is required alongside strict enforcement and a hard-hitting, high-profile advertising campaign. Since 1995, there has been little change to New Zealand's advertising campaign strategy. This approach is based on the successful Victorian (Australia) road safety model and regarded as best practice.
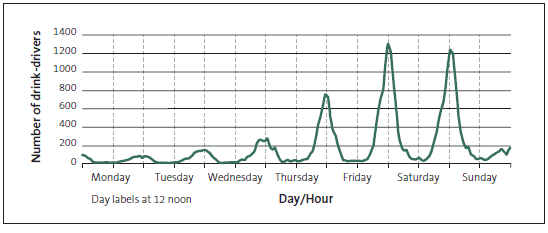
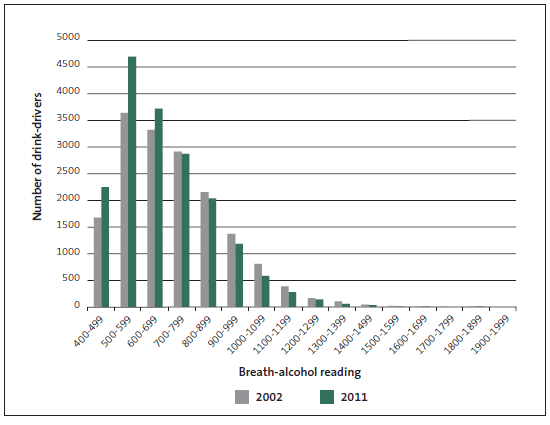
Figures 10, 11, and 12 set out statistics on the number of drink-drivers by month (in 2011), by time of day and day of week (in 2011), and by breath-alcohol content (in 2002 and 2011).
Figure 10
Drink-drivers by month, 2011
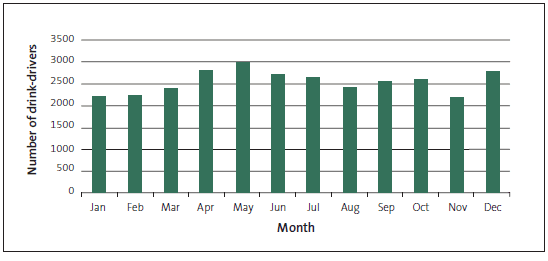
Source: Ministry of Transport, Report on motor vehicle crashes in New Zealand 2011.
Figure 11
Drink-drivers by time of day and day of week, 2011
Source: Ministry of Transport, Report on motor vehicle crashes in New Zealand 2011.
Figure 12
Drink-drivers by breath-alcohol concentration, 2002 and 2011
Source: New Zealand Police.
page top
