Part 2: Reducing the road toll
2.1
In this Part, we discuss the significant drop in the road toll and in drink-driving deaths that happened in 2011.
Summary of our findings
2.2
The annual road toll and the number of alcohol-related road deaths decreased significantly in 2011. Recent road safety outcomes have improved significantly, but it is too soon to tell whether the road toll will remain low.
2.3
The stated desired outcome in Safer Journeys for reducing alcohol- and drug-related deaths was exceeded in 2011. The road toll for the year ended 31 December decreased from 375 in 2010 to 284 in 2011, which was the lowest annual road toll since 1952. The 2011 road toll equated to a rate of 6.5 deaths for every 100,000 people, based on the current Statistics New Zealand population estimate of 4.4 million. The National Road Safety Committee noted this was a "significant decline" from the 2008 baseline measure used in Safer Journeys, which was 8.6 deaths for every 100,000 people.
2.4
In recent years, New Zealand's road toll has not been declining as fast as that of some other countries. New Zealand's road toll decreased by 5% between 2006 and 2010. In the same period, Australia's road toll decreased by 15%, the United States' by 23%, and the United Kingdom's by 42%. New Zealand's road toll for the 12 months up to June 2011 was 20% lower than it was in 2006, which brings New Zealand more into line with international trends.
2.5
The 2011 road toll figures must be read with caution. The number of drivers killed has not decreased as much as the overall road toll, there were two fewer three-day holiday weekends in 2011 (because Waitangi Day and Anzac Day were in weekends), and the effect of the Christchurch earthquakes on the regional road toll has not been fully assessed. It is too soon to know whether the drop marks the start of a consistent improvement in road safety. In 2012, the road toll was 308. Although higher than 2011, this is the second-lowest annual road toll since 1952.
Alcohol-related road deaths
2.6
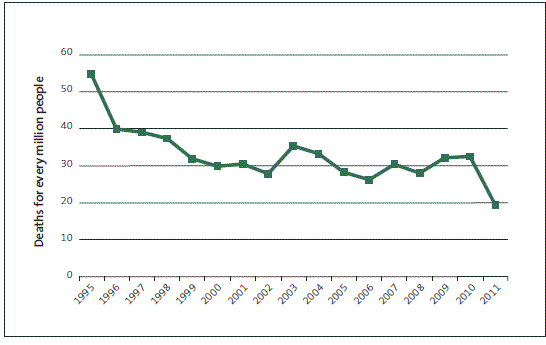
The Safer Journeys goal for alcohol and drug-impaired driving was to reduce the number of alcohol- and drug-related road deaths from 28 for every million people to 22 for every million people, and to reduce the number of serious injuries.
2.7
Between 2001 and 2010, the death rate from alcohol- and drug-related crashes fluctuated between 27 and 35 for every million people. Figure 1 shows that, in 2011, the number of alcohol-and drug-related road deaths fell significantly to 19 deaths for every million people.
2.8
It can take months to complete investigations into crashes. At the time of writing, the Ministry of Transport was unable to estimate the number of crashes in 2012 where alcohol-impaired driving was a contributing cause.
2.9
Figure 1 shows a significant drop in the number of alcohol-and drug-related road deaths between 1995 and 1996. We did not seek to explain this drop, but we note that booze buses were introduced in 1994.
Figure 1
Alcohol- and drug-related road deaths, 1995 to 2011

Source: Ministry of Transport.
2.10
Having only 19 deaths for every million people means that, in 2011, the desired outcome in Safer Journeys for reducing the effect of alcohol- and drug-impaired driving was achieved.
Social cost
2.11
The Ministry of Transport estimates that the average social cost of each road fatality is $3.7 million. The social cost of each serious injury is $390,400, and $20,700 for each minor injury.
2.12
Using crash statistics for the year ended 31 December 2010, the Ministry of Transport calculated the social cost of crashes involving alcohol and drugs at about $898 million. The calculation included 121 fatal crashes, 398 serious injury crashes, 1011 minor injury crashes, and included an allowance for non-reporting of crashes.
2.13
The Ministry of Transport estimates that alcohol- and drug-related crashes cost society $685 million for the year ended 31 December 2011. The reduction in alcohol- and drug-related crashes between 2010 and 2011 has saved an estimated $213 million.
2.14
It is too soon to tell whether the improved road safety results (and savings in social cost) are the start of a consistent improvement in road safety.

