Part 4 : Using financial statements to understand financial performance
4.1
In this Part, we describe:
- the set of indicators we have applied to financial data in local authorities' LTPs and annual reports to further understand their forecast financial performance; and
- our analysis using these indicators of the potential for financial uncertainty and risk in the local government sector.
The purpose of applying a set of indicators to understand financial performance
4.2
Two matters led us to consider a more comprehensive approach to assessing either the sector's or an individual local authority's financial performance based on financial statements.
4.3
We have started to review the cumulative financial results of all local authorities and reported this to Parliament after the 2009/10 and 2010/11 audits.25 Our approach has been to consider the financial data, primarily on the basis of trends, without a complete method for interpreting, analysing, and assessing the information. Our discussion in Part 3 is based on trends directly extracted from financial statements, and it provides a sound basic picture of the sector's financial performance.
4.4
The second matter is that the sector – partly in response to the Better Local Government reforms26 and policy-makers – has increasingly been considering what constitutes sound financial performance and whether there is any suitable benchmarking regime.
4.5
Any method for assessing extracted financial data is, and will remain, a matter of judgement. However, we consider that there is a need for a consensus within the sector and with policy-makers on what financial data is useful and reasonably reflects the performance and position of the sector and individual local authorities.
4.6
In our view, any method of assessing financial information in a more in-depth way should shed light on a local authority's financial sustainability and help with assessing whether a local authority is operating in a financially prudent way.
4.7
Currently, there is no approach that the sector, policy-makers, and local government commentators have agreed on. In this Part, we describe one possible approach using a set of indicators that builds on the analytic work we have been doing during the last couple of years.
4.8
The set of indicators is not an "audit test". It is one possible way of looking at a local authority's financial performance and position (and its financial sustainability). To consider the overall performance, position, and prospects of the sector or individual local authorities, broader non-financial information must be considered along with the financial information.
4.9
We are publishing our set of indicators to inform the debate about local authorities' financial performance, position, and prospects. Although the set represents our thinking to date, we are open to debate and discussion about the usefulness and the basis of this set of indicators.
4.10
Our intent in setting out our analysis of the 2012-22 LTPs using this set of indicators is to stimulate debate among interested parties and to help in reaching a consensus. We have already outlined the indicators and the way we use them to DIA, Local Government New Zealand, and SOLGM.
4.11
We welcome any opportunity to discuss and debate the framework and possible refinements or different approaches.
Explanation of our set of financial indicators
4.12
Performance is about achieving objectives in an uncertain environment. It is about striving for something that is attainable but not certain. Therefore, measuring and analysing performance in a comprehensive way requires understanding a local authority's objectives, the risks to achieving those objectives, and the relationship between these two elements.
4.13
The financial statements have an important role in assessing performance. Although they say little about many of the non-financial objectives of public sector organisations, they describe and summarise many of the factors that reflect the risk associated with achieving objectives (for example, through the underlying revenues, costs, liabilities, and assets).
4.14
An important part of the usefulness of financial statements lies in their ability to help a reader understand financial uncertainty27 in a standardised and comparable way. This is a fundamental part of a local authority's performance story.
Understanding and assessing the potential for financial uncertainty
4.15
Our approach to understanding the financial uncertainty of local authorities is based on our role of providing independent assurance about the performance of public sector entities to Parliament and the public. We do this through our annual audits of local authorities' financial and non-financial information.
4.16
Financial uncertainty arises from many different sources and can include economic, political, and structural changes within and outside of the local authority. We have not tried to identify or understand the root causes of uncertainty. Instead, we use the financial statements to help assess the aggregate effect on three aspects of a local authority's ability to deliver on its objectives. The three areas are:
- The stability of a local authority's activities (operations, capital, investing, and financing) is about how reliable an entity is in planning, budgeting, and delivering services using its financial resources. To help understand this component, we focus on financial statement data that indicates the consistency and accuracy of these activities (for example, by comparing actual performance with budget/forecast).
- The resilience of a local authority to short-term unanticipated events reflects how well the entity can "bounce back". To help understand this component, we consider financial information that indicates the entity's ability to respond without major structural or organisational change. For example, we look at fixed costs, interest payable, and surplus/deficit in the cash flow statement and income statement.
- The sustainability of a local authority looks at how prepared the entity is for long-term uncertainties and to maintain itself indefinitely. To help understand this component, we consider financial information that indicates how longer-term uncertainties are being managed. We focus, for example, on balance sheet items such as assets, liabilities, and debt, together with related items such as capital expenditure, and expenditure on asset renewals.
4.17
To assess the potential for uncertainty throughout the sector and the ability to cope with that uncertainty, we analysed the results of the indicators for these three areas over time, considering:
- whether the average values are within what we consider is a reasonable range;
- the direction the average values are taking (improving, declining, or constant);
- the variability in these average values over time (whether local authorities are diverging or converging); and
- the characteristics of outliers.
4.18
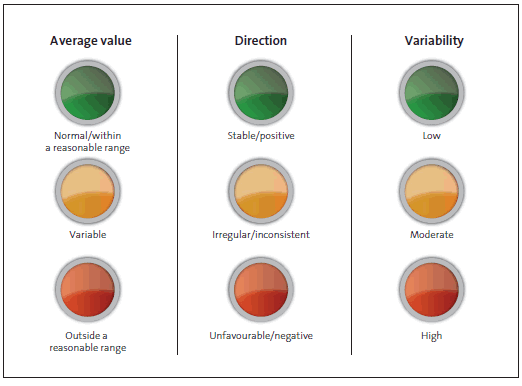
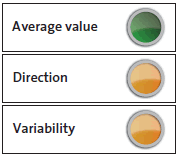
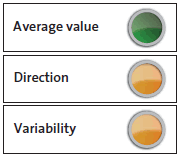
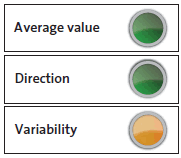
Because a degree of judgement is involved in this forecast-based assessment, we have used a traffic light system to summarise the sector's results (see Figure 12).
Figure 12
Traffic light assessment of local authorities' financial performance
4.19
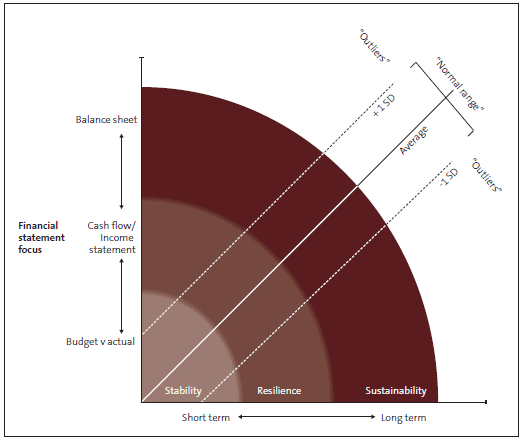
Figure 13 provides a visual presentation of our approach. It shows how sustainability builds on the stability and resilience of an organisation, and how we portray the "normal range" throughout the sector by using a standardised measure of variation on either side of the average28 – in other words, plus or minus one standard deviation.29 In the rest of this Part, we use the term "sector norm" to refer to this range of one standard deviation either way from the average for the measure concerned.
Figure 13
Understanding and assessing potential financial uncertainty
4.20
As with all analysis of financial performance, there are limitations to what can be inferred. Our approach focuses on the potential for uncertainty only and is not a comprehensive assessment of an entity's or the sector's performance. It is not an attempt to rank entities in the local government sector or between sectors. Moreover, what is shown as the normal range assumes a regularity that may not always be correct. The outliers are not necessarily more uncertain in delivering on their objectives – they may simply warrant further investigation.
4.21
Figure 14 summarises the set of indicators we have used, followed by an explanation of the information that is revealed by each.
Figure 14
Financial statement assessment framework – indicators by assessment category
| Stability | Resilience | Sustainability |
|---|---|---|
| Actual to budgeted net cash flows from operations | Interest expense to debt | Capital expenditure to depreciation |
| Actual to budgeted debt | Interest expense to rates revenue | Renewals expenditure to depreciation |
| Actual to budgeted capital expenditure | Fixed costs to operating and investing cash outflows | Gross debt to total assets |
The stability indicators
4.22
For stability, we compare local authorities' actual net cash flows from operations, debt levels, and capital expenditure with what was originally budgeted. A result of 100% indicates reliable planning, accurate budgeting, and robust delivery.
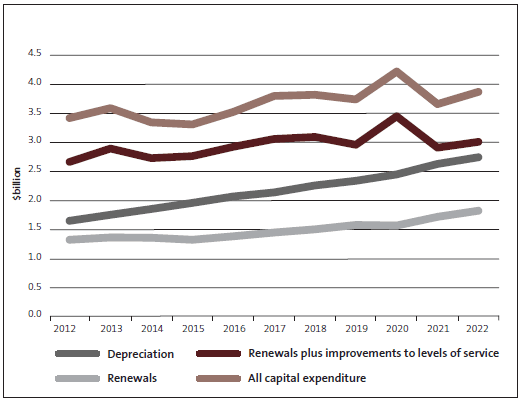
The resilience indicators
4.23
The interest to debt indicator shows the annual cost of funding local authorities' activities through debt. A higher interest rate indicates less flexibility in responding to unexpected events. It can also reflect a higher perceived risk of repayment by the debt provider.
4.24
The interest expense to rates revenue indicator shows the proportion of rates revenue that relates to the interest cost of debt. A higher percentage means less flexibility and fewer available resources in responding to unexpected events.
4.25
The fixed costs (defined as including interest expense, employee costs, and expenditure on renewals) to operating and investing cash outflows indicator shows the proportion of operating and investing flows that are not able to be easily adjusted in changing times. A higher fixed cost structure indicates less flexibility in responding to unexpected events. The lower the percentage, the more adaptability the local authority has for change.
The sustainability indicators
4.26
Relating capital expenditure to depreciation to indicate sustainability assumes that depreciation is a reasonable estimate of the capital expenditure needed to maintain the existing asset base. (This type of capital expenditure is referred to as renewals in the local authority sector.) Therefore, the assumption is that a result where capital expenditure is above depreciation (more than 100%) indicates sustainability. However, because capital expenditure also includes spending on new assets, we expect the indicator value to be over, and possibly well above, 100% in growing sectors.
4.27
The comparison of renewals expenditure to depreciation assumes that depreciation is a reasonable estimate of the capital expenditure needed to maintain or renew the existing asset base. Therefore, a result where renewals expenditure is equal to depreciation (100%) usually indicates sustainability.
4.28
The proportion of gross debt to total assets indicates a local authority's capability to manage its longer-term financial uncertainties. A result of, for example, 10% means that a local authority has debt equivalent to 10% of the value of its assets. This indicator also looks at the level of debt as a source of funding assets.
Detailed analysis using our set of financial indicators
4.29
We used the indicators described in paragraphs 4.21 to 4.28 to analyse the forecast financial statement data and assess the aggregate effect they have on the three main areas of financial uncertainty. We also comment on the local authorities that appear outside the calculated sector norms.
Stability indicators
4.30
As LTPs contain only forecast information, we looked at the actual versus budgeted results for two financial years – 2009/10 and 2010/11 – using the 2009-19 LTP financial forecasts as the budget. We will continue to collect and report on these items, as well as the other indicators described below.
4.31
With only two years of data, it is too soon to identify trends or draw firm conclusions.
Actual to budgeted net cash flows from operations
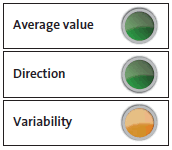
4.32
The cash flows from operations reflect a local authority's cash surplus (or deficit) from normal, business-as-usual operations.
4.33
When we calculated the sector norm for the proportion of actual to budgeted net cash flows from operations, it ranged between 58% and 131% for 2009/10 and between 47% and 144% for 2010/11.
4.34
A sustained or consistent result of 100% indicates reliable planning, accurate budgeting, and robust delivery. A result below 100% means that the local authority had achieved less than it had budgeted, and a result higher than 100% means that the local authority exceeded its budget (for example, 120% means exceeding the budget by 20%).30
4.35
As sector norms, these percentages reflect moderate variability between individual local authorities, with higher variability in 2010/11. The average in both years was 95%, which means that local authorities spent less, or that their revenue was higher than what they budgeted for, but that they still achieved a positive net operating cash flow. Most local authorities had results within the sector norms.
4.36
We consider an overall sector average of 95% to be a very good result, given the large and diverse operations that local authorities manage. However, there is room for any organisation that is not fully meeting its budget to improve performance. We encourage local authorities to work on reducing the variance, but we consider that the performance demonstrated by this small two-year sample does not indicate a significant issue for the sector.
4.37
Local authorities that fell outside the sector norm (significantly exceeding their budgets in both financial years) were Greater Wellington Regional Council and Kapiti Coast District Council. We did not identify a common reason for this, but a slowdown in growth-related capital expenditure might have influenced the level of interest on debt and also amounts paid to suppliers. Greater Wellington Regional Council's results reflected the timing of when it received central government subsidies for its public transport activities. Otago Regional Council was below the sector norm in those financial years because it budgeted for negative cash flows.
4.38
Christchurch City Council was the only local authority that had a negative net cash flow from operations in 2010/11, and this was because of earthquake-related payments to suppliers. In general, local authorities had not budgeted for negative net cash flow from operations, which is an expected and sensible approach that is consistent with prudent financial management given their need to fund capital renewals on infrastructure assets.
Actual to budgeted debt
4.39
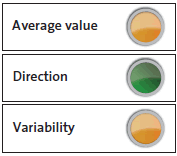
In general, local authorities borrowed less than they budgeted for. The sector norm for the proportion of actual to budgeted debt was 48% to 128% for 2009/10 (average 88%) and 41% to 139% for 2010/11 (average 90%).
4.40
The sector norm shows moderate variability in the results for comparing actual to budgeted debt. Southland District Council's result was at the extreme end – 3% in both financial years. This local authority budgeted to have debt of $19 million at 30 June 2010 and $13 million at 30 June 2011, but had a debt balance of less than $1 million at the end of both financial years. Its planned capital expenditure was largely not carried out or was funded without using debt, mainly because maturing investments became available.
Actual to budgeted capital expenditure
4.41
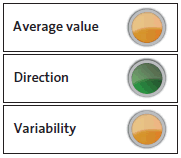
We calculated that the sector norm for the proportion of actual to budgeted capital expenditure was 11% to 153% in 2009/10 (average 82%) and 49% to 113% in 2010/11 (average 81%). Again, the sector norm shows moderate variability in local authorities' results and a consistent inability to fully deliver the forecast capital programme.
4.42
Consistent with our analysis of debt, local authorities tended to spend less than they budgeted for. The reasons included changes in priorities and/or timing of projects. Hawke's Bay Regional Council and Taupo District Council significantly exceeded the sector norms (they spent much more than they had budgeted for) in both financial years. Both of these local authorities made changes to their capital expenditure programmes.
Summary observations about stability
4.43
In summary, we consider that local authorities are delivering against their budgets in a manner that shows a moderate level of stability. Local authorities' ability to plan for, budget, and deliver on operating cash flows was good. There was less stability in their results for budgeted debt and budgeted capital expenditure.
4.44
Capital expenditure drives the level of debt required, so the actual results compared to budget of these two items were quite similar. There is evidence of a moderate level of variability throughout the sector and from year to year. The results indicate that there is likely to be scope for the sector to improve budgeting practices in these areas. We encourage all local authorities to strive to achieve a higher correlation between actual results and budget. We consider that the sector should also focus on better reporting of the reasons for budget under-expenditure so that it is clearer to the reader whether projects have been delayed, budgets were overestimated, or cost savings have been achieved.
4.45
We note that the two years we have considered are likely to have been affected by the global financial crisis and a related reduction in growth-related projects. Local authorities' capital works programmes are also affected by uncontrollable events, such as extreme weather events, which make the exact achievement of budgets extremely challenging.
Resilience indicators and trends
4.46
We looked at three indicators of resilience that consider local authorities' ability to respond to short-term shocks.
Interest expense to debt
4.47
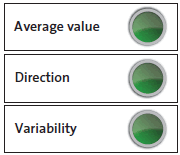
In the LTPs, the average interest rate that local authorities forecast is 5.9%, and it varies between 5.8% and 6.5% during each of the 10 years. In our view, this is reasonable given the current and forecast market interest rates.
4.48
We calculated the sector norm at between 3.1% and 8.8%. Most local authorities are within this range, with little variability. There are a few local authorities forecasting interest rates that are frequently above the norm. For example, Hawke's Bay Regional Council's LTP forecasts show an average interest rate of 13.1%. This appears high, but the Council included a fee for transfer of its leasehold portfolio in its financial forecast along with interest costs. When this fee is removed, the interest rates for Hawke's Bay Regional Council return to levels within the sector norm. (See Figure 5).
4.49
At the time of writing, 1831 local authorities are shareholders of LGFA. Part of LGFA's purpose is to obtain favourable interest rates for the sector. Members need to adhere to certain conditions of borrowing from LGFA,32 as shown in Figure 15.
Figure 15
Conditions of borrowing from LGFA
| Unrated Council or Council with credit rating below A | Council with credit rating A or above | |
|---|---|---|
| Net debt to total revenue | Less than 175% | Less than 250% |
| Net interest to total revenue | Less than 20% | Less than 20% |
| Net interest to rates revenue | Less than 25% | Less than 30% |
| Liquidity | Greater than 110% | Greater than 110% |
4.50
LGFA said in its 2011/12 annual report that:
The pricing improvement obtained has enabled LGFA to provide considerable savings in interest costs to participating local authorities. By (2011/12) financial year end, LGFA was estimated to be saving AA rated local authorities approximately 30 basis points (bps) in annual interest costs on a five year security. For unrated local authorities, the estimated savings was approximately 40 bps. By 30 June 2012, 14 out of the 18 participating local authorities had borrowed a total of $819 million (principal value) from LGFA.33
Interest expense to rates revenue
4.51
This comparison looks at the proportion of rates revenue used to service debt. A higher percentage means less flexibility and fewer resources available for responding to unexpected events.
4.52
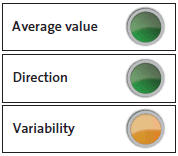
In the LTPs, the average is 9%, and it varies between 9% and 10% during each of the 10 years. We consider this reasonable for the sector. The sector norm is between 2% and 17% and reflects a moderate level of variability.
4.53
Several local authorities are below the sector norm because they have no debt or because they have little debt and will move to no debt within the LTP period.
4.54
There are more local authorities above the sector norm in the early years, with percentages close to 17%, compared to the later years of the LTPs. However, some percentages in the later years are much higher than 17%. In the last five years of its LTP, Hawke's Bay Regional Council forecasts moving from 33% and peaking at 56%. Auckland Council also forecasts 24% in 2012/13 and that increases to 32% from 2017/18 to 2021/22. These higher levels of interest expense are likely to leave those local authorities less able to respond to unexpected events.
Fixed costs to operating and investing cash outflows
4.55
We have defined fixed costs as including interest expense, employee costs, and expenditure on renewals. With this indicator, the lower the percentage, the more adaptability the local authority has for change.
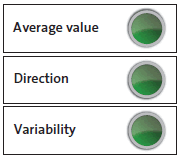
4.56
In the LTPs, the average proportion is 37%. It increases from 34% in 2012/13 to 38% by 2016/17 then fluctuates between 37% and 38% from 2017/18 to 2021/22. This shows that local authorities have quite a high proportion of funds available to use to respond to operational changes. The sector norm is between 24% and 50%, and shows low variability.
4.57
There are a similar number of outliers above and below the normal range. Local authorities often above the sector norm include Kawerau District Council, Hamilton City Council, Hauraki District Council, Rotorua District Council, Wanganui District Council, and Waikato District Council. They all have an average above 50%, with the highest being 57%. We have not been able to identify any factors common to each of these local authorities.
Summary observations about financial resilience
4.58
Overall, the three indicators of financial resilience show that local authorities have high short-term resilience. The average percentages for each indicator were relatively low. This means that, based on the LTP forecasts, local authorities are planning on a basis that will make them financially adaptable to short-term changes and shocks.
Sustainability indicators and trends
4.59
We looked at three indicators of sustainability that consider how durable a local authority is to longer-term uncertainties and in maintaining itself indefinitely.
Capital expenditure to depreciation
4.60
With this indicator, capital expenditure at a level above depreciation (that is, more than 100%) indicates sustainability, and percentages well above 100% are indicative of high growth or may reflect a peak period in the life cycle of a local authority's assets.
4.61
Overall, the average is 135%, but it decreases during the 10 years from 207% in 2012/13 to 111% in 2021/22. This shows that local authorities are forecasting to invest and/or to reinvest more in the earlier years compared to later years.
4.62
There is more variability between local authorities in 2012/13 and 2013/14 and less in 2016/17 and 2017/18. The highest proportions are 349% for Hawke's Bay Regional Council and 323% for Opotiki District Council, which reflect large projects in both of these local authorities.
4.63
Fourteen local authorities forecast an average of less than 100%. This is most common in smaller local authorities.
4.64
The proportions below 100% ranged from 72% to 98%. The level of capital expenditure forecast should be driven from the AMPs and, depending on the circumstances and asset life cycles, a lower proportion for a period of time might be appropriate. However, for these local authorities, the lower proportion could indicate that they are deferring their capital investment and will need to "catch up" on that spending at a later date. This could have significant effects on rating levels in the future.
4.65
Capital expenditure includes spending on new assets because of increased demand and spending to improve levels of service, so looking at renewals expenditure and depreciation provides a better indicator of asset sustainability when the overall proportion is higher than 100%.
Renewals expenditure to depreciation
4.66
With the renewals expenditure to depreciation indicator, results of 100% suggest sustainability. However, the average proportion is 75%, with a decreasing trend from 92% in 2012/13 to 73% in 2021/22. This shows that local authorities' forecast expenditure on maintaining assets may be less than sustainability might require.
4.67
The forecast reduction could be because:
- the assets might be new and not need renewing until later in their useful lives;
- replacement materials or technology might be cheaper than the materials needed for construction; or
- local authorities might choose not to renew some assets.
4.68
There is moderate variability in results for the early years of the LTPs and less in later years. Nine local authorities have average results of more than 100%, and another nine have average results of less than 50%. It is important to consider the life cycle renewal requirements for infrastructure systems in the context of each local authority to assess whether local authorities, those within the normal range as well as those outside it, are managing their assets on a sustainable basis.
4.69
Over time, it will be particularly interesting to watch the performance of the local authorities with low results because, in dollar terms, there is a widening gap between forecast renewals expenditure and depreciation (see Figure 16). However, the local authorities might be spending on renewals rather than spending on improving service levels. In Figure 16, the forecast expenditure on renewals and levels of service is forecast to be higher than depreciation but to converge towards it by 2021/22.
Figure 16
Forecast of all capital expenditure, renewals expenditure, and depreciation
Gross debt to total assets
4.70
With the gross debt to total assets indicator, a value higher than 100% would indicate that a local authority has more debt than the value of its assets. The forecast proportion of average debt to assets is 6%, and this is consistent for all 10 years of the LTPs. We calculated the sector norm as 1% to 11%, with more variability between local authorities in later years.
4.71
This average does not give any particular cause for concern because 6% is reasonable, given that the assets are large, generally long-lived, and primarily used to deliver essential services. This is an area where consensus as to an appropriate relationship between debt and assets could be a valuable monitoring tool for the sector.
4.72
It is worth noting that many local authority assets are not easily realisable because they are infrastructure, such as roads and water supply, wastewater, and storm water systems. The main security for servicing and repaying debt is the ability to rate. In our earlier discussion about financial resilience, we said that local authorities' interest expense to rates revenue was reasonable and averaged 9% (see paragraph 4.52).
4.73
Greater Wellington Regional Council has the highest percentage of debt to assets for the sector, with an average of 30% forecast during the period of the LTP. Auckland Council has an average of 20%. Both local authorities have specific projects that explain these higher forecast levels of debt. In the case of Greater Wellington Regional Council, certain large assets are outside the Council while debt that helped fund those assets is held by the Council.
4.74
Again, there is a high correlation between the local authorities that have the highest dollar value of debt and those that have the highest forecast debt movements.
4.75
Overall, in our view, this comparison does not reveal any local authorities with debt at abnormally high levels in comparison to their asset base. That said, we emphasise that the ability to service debt is paramount, because these assets are not easily sold.
Summary observations about financial sustainability
4.76
The level of forecast investment (all capital expenditure to depreciation) and reinvestment (renewals to depreciation) is higher in the earlier years than in the later years of the LTPs. We also saw variability, with some local authorities forecasting to invest significantly more or less on their capital works in the early years but converging in the later years. We expect local authority forecasts to be less reliable in the later years of the LTP.34
4.77
Overall, the debt to total assets percentage is forecast to be low, which indicates that local authorities generally have a low debt-loading risk in comparison to the volume of assets held.
Overall conclusion
4.78
Our assessment of the potential for financial uncertainty and risk in individual local authorities (and, by implication, for the whole sector) is that it is mainly related to the ability of local authorities to be sustainable in the longer term. This is based on what appears to be declining capital investment toward the end of the 10 years and shorter-term difficulties in forecasting capital and funding needs. These results serve to emphasise the importance of robust asset management planning for the local authority sector.
4.79
However, local authorities' planning and budgeting for their operational activities is reliable, and local authorities are resilient to short-term uncertainties.
25: We will be reporting the 2011/12 annual audit results in March 2013.
26: See www.dia.govt.nz/better-local-government.
27: The terms risk and uncertainty can mean different things. For simplicity, we use the terms interchangeably to mean the potential for variation on either side of what is expected or considered normal. For instance, in a public sector entity, a large operating surplus can be as much an indicator of uncertainty (or risk) as a large operating deficit.
28: The average is generally close to the middle of the data range. It is calculated by dividing the sum of the total data set by the size of the data set.
29: Standard deviation is a statistical measure of how far the data points are spread out. A small standard deviation indicates that the data points tend to be close to the average. A large standard deviation indicates that the data points tend to be further from the average.
30: We noted that a few local authorities had budgeted for negative net cash flow from operations in one or both years, which is unusual for local authorities.
31: The 18 local authorities are Auckland Council, Bay of Plenty Regional Council, Christchurch City Council, Hamilton City Council, Hastings District Council, Masterton District Council, Greater Wellington Regional Council, New Plymouth District Council, Otorohanga District Council, Selwyn District Council, South Taranaki District Council, Tasman District Council, Taupo District Council, Tauranga City Council, Waipa District Council, Wellington City Council, Western Bay of Plenty District Council, and Whangarei District Council.
32: It is possible for local authorities to negotiate individual financial covenants with the LGFA Board. The LGFA definition of total revenue excludes some revenue sources, including development contributions and vested assets.
33: New Zealand Local Government Funding Agency Limited, Annual Report 2011-12, page 6.
34: Clause 2(1)(d) of Schedule 10 of the Act requires detailed information in the LTP for each of the first three years and outline information about each of the subsequent years. In practice, readers see minimal difference between any of the 10 years – but the level of refinement and accuracy of the forecasts will inevitably be less for later years.
page top
