Part 3: Financial trends and financial information
3.1
In this Part, we discuss:
- the main features of local authorities' financial forecasts; and
- broad financial performance trends in the LTPs.
3.2
Our financial analysis includes 77 local authorities. Christchurch City Council is excluded because it elected not to prepare and adopt a 2012-22 LTP (legislation enacted after the Canterbury earthquakes gave the Council that option). Christchurch City Council will be preparing and adopting an LTP before 1 July 2013. The plan will cover a period of not less than nine years, starting on that date.13
3.3
All local authorities except Auckland Council prepared an LTP that included council-only financial forecasts. Auckland Council chose to prepare an LTP that covers the Council and its group of council-controlled organisations.14 Auckland Council's group financial forecasts are significant. For some of our analysis, we have shown the Auckland Council group separately or made adjustments to see the trends arising from all of the other local authorities without being dwarfed by the Auckland Council group.
3.4
Although Kaipara District Council is receiving publicity for the issues it is currently dealing with, the forecasts in its LTP do not have any significant effect on the sector-wide results discussed in this Part and Part 4.
3.5
The Department of Internal Affairs (DIA) collated all of the financial information in the final 2012-22 LTPs and made the information available to us for further analysis.
3.6
In Part 4, we assess the financial performance of local authorities more comprehensively, looking at their financial performance in terms of stability, resilience, and sustainability.
Main features in the financial forecasts
3.7
The following is our summary of the main features in the financial forecasts:
- Total rates income during the 10 years is forecast at $54.2 billion, and makes up 52% of the total forecast operating income.
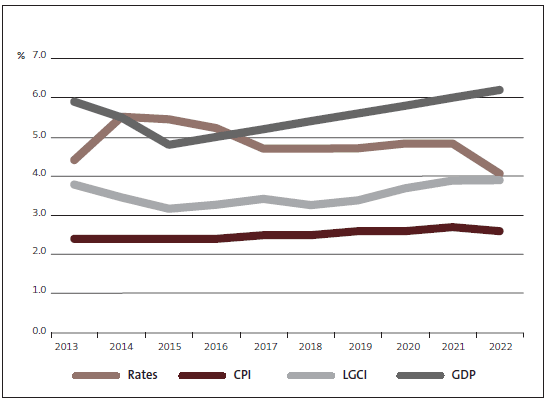
- Total rates income is forecast to increase from $4.1 billion15 in 2011/12 to $6.6 billion in 2021/22. The year-on-year movement is, on average, 5%. (For Auckland Council, the average is 6.1%, and for all other local authorities combined the average is 4.3%). The sector-wide average exceeds the forecast increases in the Consumer Price Index (CPI)16 and the Local Government Cost Index (LGCI)17. However, forecast GDP18 growth exceeds the forecast rate increases in every year but 2014/15 and 2015/16.
- Total operating expenditure is forecast to increase from $7.7 billion in 2011/12 to $11.3 billion in 2021/22. The year-on-year movement is, on average, 4%.
- Net operating income19 is forecast to steadily increase from $414 million in 2011/12 to $979 million in 2021/22.
- Local authorities plan to spend $36.8 billion on capital works in the 10 years to 2021/22. Of this, $7.1 billion is because of additional demand (19%), $14.7 billion is to improve the levels of service (40%), and $15.0 billion is on asset replacement or renewal (41%).
- Gross debt is forecast to increase from $9.8 billion in 2011/12 to $18.7 billion in 2021/22. Auckland Council's group debt is significant – for each year, it represents more than half of the whole sector's total debt.
- Total local authority assets are forecast to rise from $106.1 billion in 2011/12 to $156.3 billion in 2021/22.
Broad financial performance trends
Forecast trends in rates revenue
3.8
Local authorities plan to collect $54.2 billion in rates during the 10 years to 2021/22. This rates income makes up 52% of the total forecast operating income of $103.8 billion. For Auckland Council, the proportion is 43%, and for other local authorities it is 58% overall. The other main sources of operating income are subsidies and grants of $10.1 billion (10%), development and financial contributions and vested assets20 of $4.5 billion (4%), and other income, mainly fees and charges, of $34.9 billion (34%).
3.9
Rates revenue, at 52% of total operating income, is consistent with historical results – 53% in 2008/09, 52% in 2009/10, and 54% in 2010/11.
3.10
Rates revenue is forecast to increase 4.4% from 2011/12 to 2012/13, 6% from 2012/13 to 2013/14, 5% year-on-year in the next seven years, and 4% from 2020/21 to 2021/22. This compares with the 2009-19 LTPs, where the year-on-year increase in total rates ranged from 4% for the lowest increase to 7% for the highest increase.21
3.11
The forecast rate increases continue to be more than forecast increases in the CPI and the LGCI. However, when we compare the forecast rate increases to projected GDP increases, the projected GDP increases exceed the forecast rate increases in all years except 2014/15 and 2015/16 (see Figure 6). On a sector-wide basis, and given that improvements to service are expected, the forecast rate increases do not appear to be unreasonable compared to GDP. However, we acknowledge that affordability for individual ratepayers is affected by factors other than national GDP results. These factors include movements in food prices reflected in the CPI and housing affordability.
Figure 6
Forecast rate increases compared with projected CPI, LGCI, and GDP increases from 2012/13 to 2021/22
3.12
In the LTPs, local authorities used a number of approaches to set their limits on rate increases (as required by the new financial strategy section of the Act – see paragraph 2.6). These included capping rate increases to CPI, LGCI, or LGCI increases with a percentage added.
3.13
Figure 6 shows that the sector as a whole has forecast overall rate increases above the LGCI. Although many local authorities in their LTPs have used forecast LGCI increases as the rates cap in their financial forecasts, the overall sector position is affected by some local authorities using the LGCI plus a percentage and by some forecasting to go beyond their stated limits on rate increases in one or more of the years of the 2012-22 LTP. Where this has occurred, they have disclosed why in their financial strategy. Some of the reasons include a requirement for higher rates to fund a particular project in those years. The disclosures made by individual local authorities play an integral part in explaining a local authority's funding approach and financial risk management practices.
3.14
Although the level of rates revenue as a proportion of total operating income is 52% on average, there is wide variability between individual local authorities. Eight local authorities have forecast rates revenue that is 70%-84% (on average) of their total operating income.
3.15
On the other hand, three local authorities are forecasting that less than 40% of their total operating income will come from rates. Local authorities with lower proportions of income funded from rates typically have other major sources of funding – such as income from investments.
3.16
At the extreme end, Chatham Islands Council forecasts that 6% of its operating income will come from rates. This local authority has about 600 residents and relies heavily on central government funding for its operational and capital expenditure.
3.17
Each local authority has different revenue and financing policies and investment structures, which significantly affect the mix of its income.
Forecast trends in operating expenditure
3.18
Total operating expenditure for the sector is forecast to rise from $7.7 billion in 2011/12 to $11.3 billion by 2021/22. The average year-on-year increase is 4% during the period of the LTPs.
3.19
Total operating expenditure is made up of four items: depreciation (23%), employee costs (18%),22 interest expenses (10%), and other operating costs (49%).
3.20
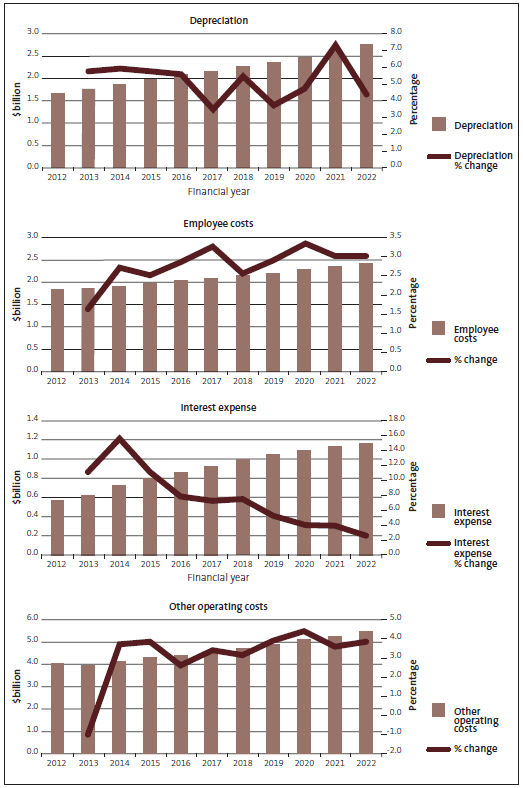
The graphs in Figure 7 show the increasing expenditure and the year-on-year percentage movement for each of these four expenditure items during the period of the LTPs. We observe that:
- Depreciation is forecast to be, on average, 1.8% of the property, plant, and equipment balance. As well as being affected by large asset purchases, depreciation reflects a cyclical trend consistent with the requirement to forecast asset revaluations. Asset revaluations are required to be done regularly enough to ensure that the asset value disclosed is not materially different to the fair value.
- Employee costs are forecast to increase annually by between 2.5% and 3.0%. This is slightly higher than the inflation movement projected for staff costs in the LGCI forecasts, which are between 2.4% and 2.7% annually.
- Interest expenses are forecast to increase annually, but the year-on-year changes show a decreasing trend. This is consistent with the forecast debt movement.
- Other operating expenditure shows an increasing trend with annual fluctuations. The percentage change between 2011/12 and 2012/13 is negative because of the timing of Greater Wellington Regional Council's transport expenditure,23 which decreases from $265 million in 2011/12 to $176 million in 2012/13. Without this $89 million decrease, the percentage change between 2012/13 and 2013/14 would have been 2.4% rather than the 4.6% reflected in the graph.
Figure 7
Trends in depreciation, employee costs, interest expenses, and other operating expenditure
Forecast trends in net operating income and total comprehensive income
3.21
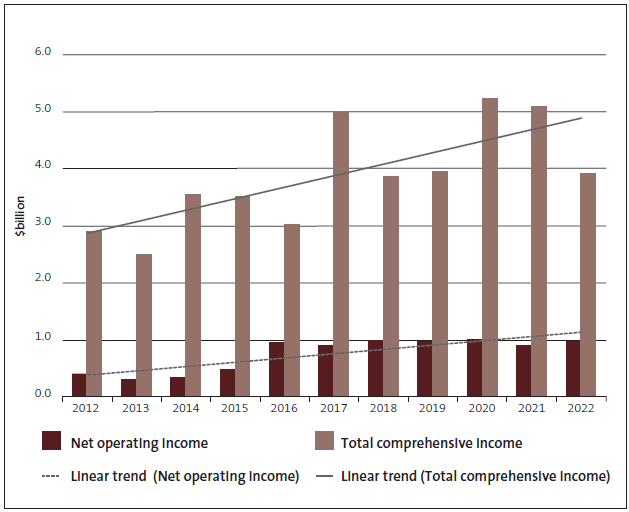
Forecast net operating income for all local authorities steadily increases during the 10-year period of the LTPs (see Figure 8). This is because several local authorities are setting more aside to provide for asset renewal during the 10 years. The depreciation charge is used as a proxy for renewal funding needs because it reflects the annual consumption of an asset. Local authorities fund some or all of the depreciation, and the funds are used for asset replacement or renewal and debt repayment.
3.22
Forecast comprehensive income (net operating income plus asset revaluations) fluctuates during the 10-year period because of asset valuations (usually every three years). Figure 8 shows that, on average, surpluses are increasing during the 10 years. This is because the underlying value of the depreciable assets is increasing over time. This is an expected trend because capital expenditure exceeds depreciation in each of the 10 years of the LTPs and asset revaluations are also forecast to be positive during that period.
Figure 8
Net operating income and total comprehensive income trends
Forecast trends in capital expenditure
3.23
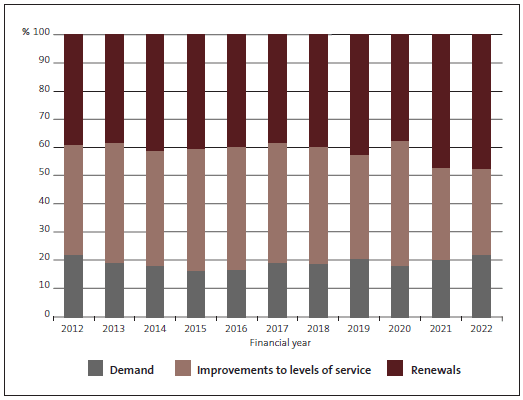
Local authorities plan to spend $36.8 billion on capital works in the 10 years to 2021/22. Of this, $7.1 billion (19%) will be for new assets to meet additional demand, $14.7 billion (40%) is to improve service levels, and $15 billion (41%) is to replace or renew assets. However, Figure 9 shows that the proportion spent on these three types of capital works varies during the 10 years. Of the total sector forecast, Auckland Council plans to spend $20 billion in total, with $4.5 billion for new assets to meet additional demand (63% of the total sector expenditure), $9.7 billion to improve service levels (52% of total sector expenditure), and $5.8 billion to replace or renew assets (39% of total sector expenditure).
Figure 9
Percentage of capital works to be spent on additional demand, improvements to levels of service, and renewals from 2012/13 to 2021/22
3.24
Local authorities are facing increased spending to meet regulatory standards (for example, water supply standards); community expectations on service levels; changing demographics, population, and land use; and having to balance these against what is reasonably affordable for their communities. Figure 9 shows that, in the last two years of the LTPs, the proportion spent on renewals is forecast to increase, while the proportion on improving levels of service will decrease. This is consistent with the dollar value expenditure in the last two years of the LTPs, where the amount to be spent on renewals increases from $1.6 billion in 2019/20 to $1.7 billion in 2020/21 and to $1.8 billion in 2021/22. The forecast expenditure on improving levels of service falls from $1.9 billion in 2019/20 to $1.2 billion in 2021/22.
3.25
We consider that this largely reflects local authorities moving to more fully fund depreciation. Auckland Council is an example of this. It is progressively moving to fully fund depreciation during a 13-year period. It has forecast expenditure on renewals to jump from $626 million in 2019/20 to reach its highest level during the LTP period of $725 million in 2021/22. Auckland Council's forecast expenditure on renewals for 2021/22 represents 40% of the sector total.
3.26
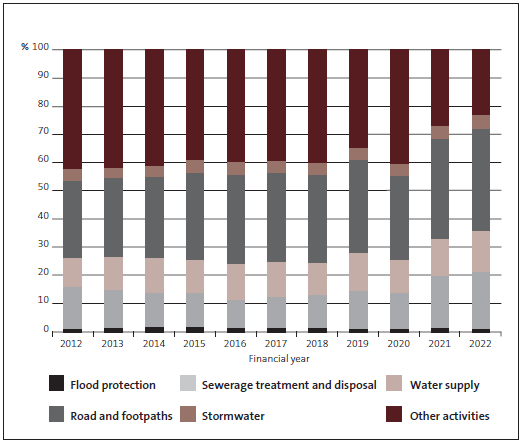
The proportion of all local authority capital expenditure on five infrastructure groups of activities24 is forecast to rise from 58% in 2011/12 to 77% by 2021/22, mainly in the last two years. Generally, the split of capital expenditure for these five activities is shared in a reasonably uniform way (see Figure 10).
Figure 10
Forecast capital expenditure by the five infrastructure groups of activity and other
3.27
About one-third of the total capital expenditure is expected to be for roading and footpaths. Most local authorities rely on subsidies from the New Zealand Transport Agency to support the funding of their transport capital expenditure programmes. The subsidies are not the only source of funding for roading and footpaths, but they are significant.
3.28
Capital expenditure on sewage treatment and disposal is between 10% and 14% for the first eight years, then increases to 19% and 20% in 2020/21 and 2021/22. This reflects significant forecast spending for certain local authorities in the last two years of the LTP. Those local authorities include Auckland Council, Tauranga City Council, Thames-Coromandel District Council, Waimakariri District Council, Hutt City Council, and Queenstown-Lakes District Council. We are aware that, for a number of these local authorities, such as Thames-Coromandel District Council, the projects forecast for the end of the LTP period are dependent on growth and will be deferred if growth slows or does not eventuate.
3.29
Capital work on other non-infrastructural asset activities will account for about 40% of the total capital expenditure in most of the years and then drop to 27% and 23% in the last two years, mainly as a result of the large increases in roading and sewage expenditure. Based on the information in LTPs, this capital work reflects forecast investment in economic development activities and a combination of community and/or discretionary projects.
Forecast trends in debt
3.30
The gross debt for local authorities is forecast to increase from $9.8 billion in 2011/12 to $18.7 billion by 2021/22. Five of the 77 local authorities forecast no debt during the 10 years.
3.31
Figure 11 shows that debt is forecast to increase consistently during the 10 years and is significantly influenced by Auckland Council's group debt. Auckland Council's group debt starts at $4.8 billion in 2011/12 and is forecast to reach $12.5 billion in 2021/22 (see the discussion about Auckland Council at paragraphs 5.4-5.25).
3.32
Total debt for all other local authorities is forecast to increase from $5 billion in 2011/12 to $6.2 billion in 2017/18 and then drop to $6.0 billion in 2021/22. Many local authorities are looking to reduce their debt in the later years of the LTP, which Figure 11 shows.
Figure 11
Debt at the end of each financial year from 2011/12 to 2021/22
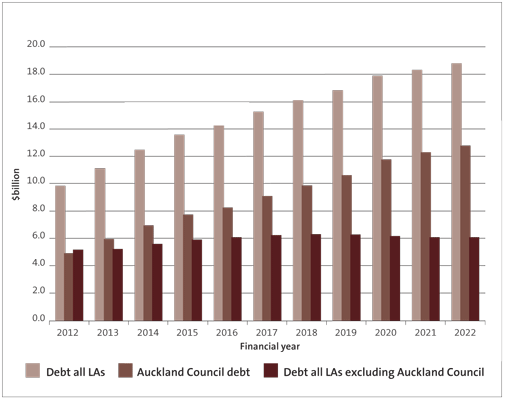
Note: The printed version of this report contained an error in the scale of debt shown at the left-hand side of Figure 11, which has been corrected here.
3.33
Local authorities use debt to fund long-life assets. As a general principle, debt should not be used to fund operations. We identified a few local authorities that did not fully adhere to this principle in the 2012-22 LTPs. However, the amounts were not considered significant and the approach was not used long term. Furthermore, local authorities usually use debt to fund new assets to meet demand or to increase levels of service, rather than using debt to fund renewals. However, local authorities can choose to use debt to fund any type of capital expenditure. Given the evidence of increased surpluses in the LTP period, we expect decreasing proportions of debt to be used to renew or replace existing assets.
3.34
Figure 11 shows that debt is forecast to continue increasing, but at a slowing rate in later years.
3.35
In Part 4, we consider debt and debt servicing from a risk perspective. Appendix 2 sets out a table of forecast debt by local authority.
13: See Canterbury Earthquake (Local Government Act 2002) Order (No 2) 2011, clause 7(3).
14: See the Local Government Act 2002, Schedule 10, Part 1, clause 12(2). An LTP may include, for each of the financial years covered by the plan or for any of those years, forecast financial statements for any council-controlled organisation or any other entity under the local authority's control.
15: We collated this number from the 2012-22 LTPs because local authorities were required to include 2011/12 comparative information in their LTPs.
16: Increases in rates are often compared with the movement in the CPI. The CPI is heavily weighted to household goods, such as food and alcoholic beverages. The average level of price inflation over the forecast period is expected to remain consistent with the current Policy Targets Agreement between the Minister of Finance and the Governor of the Reserve Bank of New Zealand. The relevant phrase in this agreement, which targets inflation as measured by the CPI, states "... the policy target shall be to keep future CPI inflation outcomes between 1 per cent and 3 per cent on average over the medium term, with a focus on keeping future average inflation near the 2 per cent target midpoint."
17: Local authorities typically apply the LGCI to forecast their expenditure, rather than the CPI. The LGCI includes a general goods and services index, the transport capital expenditure index, and the "three waters" (wastewater, storm water, and freshwater) capital expenditure index. Therefore, the LGCI is a more accurate measure of costs local authorities face than the CPI. SOLGM commissioned Business and Economic Research Limited to forecast inflation/price changes for the 2012-22 period for local authorities to use as a basis for preparing their forecast financial information.
18: The GDP is New Zealand's official measure of economic growth.
19: Net operating income is the net position calculated by deducting total operating expenditure from total operating income.
20: Vested assets are assets that are transferred to a local authority at nominal or zero cost. Typically, they might result from a situation where a developer has installed assets when developing a site and, after completion, the developer passes them to the local authority. The fair value of these assets has to be determined and is then recognised as revenue in the year of transfer. The assets are then integrated into the local authority's asset information system so that they can be appropriately managed.
21: Matters arising from the 2009-19 long-term council community plans, page 25, paragraph 3.10.
22: Sixteen local authorities did not split out employee costs in their 2012-22 LTPs. Therefore, employee costs are understated and other operating costs overstated in this section because this information was not available from the main financial statements used for this analysis.
23: Greater Wellington Regional Council receives transport improvement grants and subsidies from central government. This is accounted for as operating income when the Regional Council receives it. It is then disbursed as operating expenditure to the subsidiary that owns and maintains the train infrastructure (Greater Wellington Rail Limited).
page top
