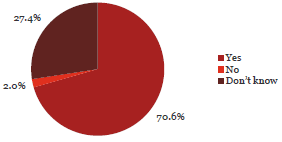
31. Internal controls are reviewed as part of every fraud investigation.
Observation:

70.6% of respondents said that their organisation reviews its internal controls as part of every fraud investigation.
Chief executives (82%) and senior managers (77%) were more confident of this occurring than line managers (55%) and operational staff (47%).
Airports (47%), Port Companies (50%), Government Departments (60%), Crown Research Institutes (62%), State-Owned Organisations (62%), “Local Government-Other” organisations (64%) and District Health Boards (67%) were among those less likely to review internal controls as part of every fraud investigation.
What some respondents have said:
“I do know of one case of Fraud (falling outside of the two years) that was reported to the Police and it did result in a review of credit card review of spending.”
“As an organisation with employees in countries other than NZ, incidents may not be reported to the police where it is unlikely that the Police will be in a position to investigate e.g. some Asian countries. Since disciplinary action is usually dismissal, specific incidents are not communicated to all staff. However, information uncovered during an investigation is used to improve systems and processes.”
“We have only had one reported incident in the last three years. It was thoroughly investigated. No issue of fraud was found. However it did result in process improvements being put in place.”
“We have many checks in our system, but this survey has highlighted the need for us to regularly review our processes.”
| Yes | No | Don’t know | Total Count | ||||
|---|---|---|---|---|---|---|---|
| Chief Executive Officer/Managing Director/Principal | 310 | 82% | 14 | 4% | 56 | 15% | 380 |
| Member of the senior executive/leadership team or equivalent | 375 | 77% | 6 | 1% | 108 | 22% | 489 |
| Line manager (if not one of the above) | 120 | 55% | 6 | 3% | 93 | 42% | 219 |
| Administration/Support Services | 136 | 68% | 1 | 1% | 63 | 32% | 200 |
| Operational staff (e.g. Teacher, Analyst, Advisor, Technician, Officer, Engineer, Accountant) | 64 | 47% | 2 | 1% | 70 | 51% | 136 |
| Total | 1,005 | 71% | 29 | 2% | 390 | 27% | 1,424 |
| Yes | No | Don’t know | Total Count | ||||
|---|---|---|---|---|---|---|---|
| Central Government | |||||||
| Autonomous Crown Entities | 44 | 81% | 1 | 2% | 9 | 17% | 54 |
| Central Government - Other | 36 | 80% | 0 | 0% | 9 | 20% | 45 |
| Crown Agents or Companies | 64 | 74% | 2 | 2% | 21 | 24% | 87 |
| Crown Research Institutes | 23 | 62% | 0 | 0% | 14 | 38% | 37 |
| District Health Boards | 47 | 67% | 0 | 0% | 23 | 33% | 70 |
| Government Departments | 87 | 60% | 3 | 2% | 55 | 38% | 145 |
| Independent Crown Entities | 21 | 57% | 0 | 0% | 16 | 43% | 37 |
| Māori Trust Boards | 9 | 82% | 1 | 9% | 1 | 9% | 11 |
| Rural Education Activities Programmes | 8 | 73% | 0 | 0% | 3 | 27% | 11 |
| State-Owned Enterprises | 29 | 62% | 1 | 2% | 17 | 36% | 47 |
| Tertiary Education Institutions | 70 | 77% | 0 | 0% | 21 | 23% | 91 |
| Sub-Total | 438 | 69% | 8 | 1% | 189 | 30% | 635 |
| Yes | No | Don’t know | Total Count | ||||
|---|---|---|---|---|---|---|---|
| Local Government | |||||||
| Airports | 9 | 47% | 0 | 0% | 10 | 53% | 19 |
| Council Controlled Organisations or Council Controlled Trading Organisations | 57 | 76% | 1 | 1% | 17 | 23% | 75 |
| Energy Companies | 21 | 75% | 1 | 4% | 6 | 21% | 28 |
| Fish and Game Councils | 7 | 88% | 0 | 0% | 1 | 13% | 8 |
| Licensing and Community Trusts | 6 | 67% | 0 | 0% | 3 | 33% | 9 |
| Local Authorities | 120 | 71% | 7 | 4% | 42 | 25% | 169 |
| Local Government - Other | 7 | 64% | 1 | 9% | 3 | 27% | 11 |
| Port Companies | 1 | 50% | 0 | 0% | 1 | 50% | 2 |
| Sub-Total | 228 | 71% | 10 | 3% | 83 | 26% | 321 |
| Schools | 339 | 72% | 11 | 2% | 118 | 25% | 468 |
| Total | 1,005 | 71% | 29 | 2% | 390 | 27% | 1,424 |

