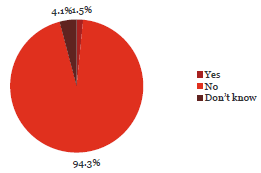
25. I am aware of fraud or corruption incidents in the last two years that have gone unreported by my organisation.
Observation:

94.3% of respondents are not aware of any fraud that has gone unreported by their organisation.
This view was shared by senior managers and staff alike and across all sectors.
What some respondents have said:
“We have had two instances of fraud, in my time with the organisation, both of which have involved significant amounts of money and we have chosen to handle the process internally without involving the police. These have been related to time sheet fraud.”
“It is poor and there have been a number of things that senior management are aware off but have not followed through with an investigation. They don't take it seriously or see the flow on effects.”
“The decision to report frauds to Police or not is interesting... we had a case where an employee was falsifying cyclical stock count records - in our eyes a breach of the managers responsibilities and prima facie evidence of more sinister fraud. However, we were unable to prove more serious fraud - and indeed did not suspect the employee. However, the action was regarded as gross misconduct and the employee dismissed. The point is that there are areas of grey and it is not always completely obvious. If a staff member took a packet of biscuits the police would not be informed but the staff would be dismissed.”
| Yes | No | Don’t know | Total Count | ||||
|---|---|---|---|---|---|---|---|
| Chief Executive Officer/Managing Director/Principal | 6 | 2% | 368 | 96% | 8 | 2% | 382 |
| Member of the senior executive/leadership team or equivalent | 6 | 1% | 469 | 96% | 14 | 3% | 489 |
| Line manager (if not one of the above) | 6 | 3% | 197 | 90% | 16 | 7% | 219 |
| Administration/Support Services | 1 | 1% | 187 | 94% | 12 | 6% | 200 |
| Operational staff (e.g. Teacher, Analyst, Advisor, Technician, Officer, Engineer, Accountant) | 3 | 2% | 124 | 91% | 9 | 7% | 136 |
| Total | 22 | 2% | 1,345 | 94% | 59 | 4% | 1,426 |
| Yes | No | Don’t know | Total Count | ||||
|---|---|---|---|---|---|---|---|
| Central Government | |||||||
| Autonomous Crown Entities | 1 | 2% | 51 | 94% | 2 | 4% | 54 |
| Central Government - Other | 0 | 0% | 44 | 98% | 1 | 2% | 45 |
| Crown Agents or Companies | 2 | 2% | 81 | 93% | 4 | 5% | 87 |
| Crown Research Institutes | 0 | 0% | 36 | 95% | 2 | 5% | 38 |
| District Health Boards | 1 | 1% | 64 | 91% | 5 | 7% | 70 |
| Government Departments | 3 | 2% | 134 | 92% | 8 | 6% | 145 |
| Independent Crown Entities | 0 | 0% | 36 | 97% | 1 | 3% | 37 |
| Māori Trust Boards | 1 | 9% | 10 | 91% | 0 | 0% | 11 |
| Rural Education Activities Programmes | 0 | 0% | 11 | 100% | 0 | 0% | 11 |
| State-Owned Enterprises | 1 | 2% | 40 | 85% | 6 | 13% | 47 |
| Tertiary Education Institutions | 2 | 2% | 83 | 91% | 6 | 7% | 91 |
| Sub-Total | 11 | 2% | 590 | 93% | 35 | 6% | 636 |
| Yes | No | Don’t know | Total Count | ||||
|---|---|---|---|---|---|---|---|
| Local Government | |||||||
| Airports | 0 | 0% | 18 | 95% | 1 | 5% | 19 |
| Council Controlled Organisations or Council Controlled Trading Organisations | 1 | 1% | 73 | 97% | 1 | 1% | 75 |
| Energy Companies | 0 | 0% | 28 | 100% | 0 | 0% | 28 |
| Fish and Game Councils | 0 | 0% | 8 | 100% | 0 | 0% | 8 |
| Licensing and Community Trusts | 0 | 0% | 8 | 89% | 1 | 11% | 9 |
| Local Authorities | 7 | 4% | 160 | 95% | 2 | 1% | 169 |
| Local Government - Other | 0 | 0% | 11 | 100% | 0 | 0% | 11 |
| Port Companies | 0 | 0% | 2 | 100% | 0 | 0% | 2 |
| Sub-Total | 8 | 2% | 308 | 96% | 5 | 2% | 321 |
| Schools | 3 | 1% | 447 | 95% | 19 | 4% | 469 |
| Total | 22 | 2% | 1,345 | 94% | 59 | 4% | 1,426 |

