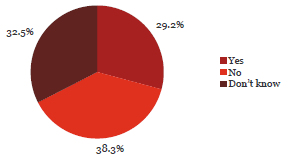
24. Management communicates incidents of fraud to all staff at my organisation.
Observation:

Communication of fraud incidents is poor (with 70.8% of respondents answering “No” or “Don’t know”) at all levels and across all sectors.
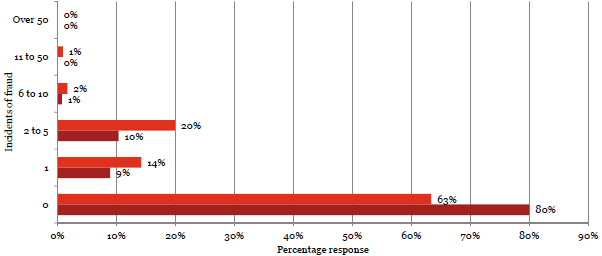
Organisations that had communicated previous incidents of fraud to staff, in general, suffered fewer incidents of fraud.
What some respondents have said:
“We report to our governance, but not necessarily to our staff. This is due to a number of the incidents quickly becoming linked to employment processes and their confidentialities. But, the informal grapevine is well fed, in my observation.”
“I am aware, through indirect sources, (whispered chit-chat with colleagues) that there has been recent serious fraud against the organisation from an external source. However, I am not sure of the details or what eventuated. I understand it was reported somewhere in the media but I didn't see it and haven't heard anything further.”
“We do not publish details of fraud cases where staff privacy may be compromised nor do we report cases in detail that give staff details out.”
“We introduced a new fraud and corruption policy two years ago. We made the decision at that time that any future fraud detected would be communicated widely to staff.”
| Yes | No | Don’t know | Total Count | ||||
|---|---|---|---|---|---|---|---|
| Chief Executive Officer/Managing Director/Principal | 169 | 44% | 140 | 37% | 73 | 19% | 382 |
| Member of the senior executive/leadership team or equivalent | 148 | 30% | 202 | 41% | 139 | 28% | 489 |
| Line manager (if not one of the above) | 31 | 14% | 105 | 48% | 83 | 38% | 219 |
| Administration/Support Services | 45 | 23% | 54 | 27% | 101 | 51% | 200 |
| Operational staff (e.g. Teacher, Analyst, Advisor, Technician, Officer, Engineer, Accountant) | 23 | 17% | 45 | 33% | 68 | 50% | 136 |
| Total | 416 | 29% | 546 | 38% | 464 | 33% | 1,426 |
| Yes | No | Don’t know | Total Count | ||||
|---|---|---|---|---|---|---|---|
| Central Government | |||||||
| Autonomous Crown Entities | 19 | 35% | 18 | 33% | 17 | 31% | 54 |
| Central Government - Other | 19 | 42% | 14 | 31% | 12 | 27% | 45 |
| Crown Agents or Companies | 31 | 36% | 33 | 38% | 23 | 26% | 87 |
| Crown Research Institutes | 10 | 26% | 8 | 21% | 20 | 53% | 38 |
| District Health Boards | 19 | 27% | 34 | 49% | 17 | 24% | 70 |
| Government Departments | 32 | 22% | 66 | 46% | 47 | 32% | 145 |
| Independent Crown Entities | 8 | 22% | 9 | 24% | 20 | 54% | 37 |
| Māori Trust Boards | 6 | 55% | 3 | 27% | 2 | 18% | 11 |
| Rural Education Activities Programmes | 7 | 64% | 0 | 0% | 4 | 36% | 11 |
| State-Owned Enterprises | 12 | 26% | 25 | 53% | 10 | 21% | 47 |
| Tertiary Education Institutions | 12 | 13% | 49 | 54% | 30 | 33% | 91 |
| Sub-Total | 175 | 28% | 259 | 41% | 202 | 32% | 636 |
| Yes | No | Don’t know | Total Count | ||||
|---|---|---|---|---|---|---|---|
| Local Government | |||||||
| Airports | 7 | 37% | 5 | 26% | 7 | 37% | 19 |
| Council Controlled Organisations or Council Controlled Trading Organisations | 33 | 44% | 12 | 16% | 30 | 40% | 75 |
| Energy Companies | 12 | 43% | 12 | 43% | 4 | 14% | 28 |
| Fish and Game Councils | 6 | 75% | 1 | 13% | 1 | 13% | 8 |
| Licensing and Community Trusts | 5 | 56% | 4 | 44% | 0 | 0% | 9 |
| Local Authorities | 43 | 25% | 78 | 46% | 48 | 28% | 169 |
| Local Government - Other | 5 | 45% | 2 | 18% | 4 | 36% | 11 |
| Port Companies | 0 | 0% | 1 | 50% | 1 | 50% | 2 |
| Sub-Total | 111 | 35% | 115 | 36% | 95 | 30% | 321 |
| Schools | 130 | 28% | 172 | 37% | 167 | 36% | 469 |
| Total | 416 | 29% | 546 | 38% | 464 | 33% | 1,426 |
Observation:
Organisations that had communicated previous incidents of fraud to staff, in general, suffered fewer incidents of fraud.


