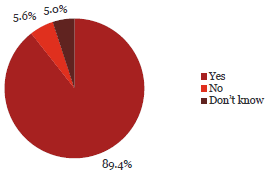
8. I am confident that managers in my organisation understand their responsibilities for preventing and detecting the risks of fraud and corruption.
Observation:

89.4% of respondents were confident that their managers understood their responsibilities in relation to fraud.
Senior management answered this question more positively. Around 95% of executives and senior management answered “Yes” to this question. Around 80% of line managers or below answered “Yes”.
Of the management group, line managers indicated they were less confident of knowing what their responsibilities for preventing and detecting fraud were.
What some respondents have said:
“Clear tone from the top supporting the organisation's fraud policy.”
“We have not had any incidents of fraud and/or corruption. However, it is a regular staff topic, and the CEO makes clear that his and any staff member's computer, work phones or desks etc can be accessed at any time; and from time to time does do so as part of ensuring that he can undertake other people's task in their absence; and staff are encouraged to report suspicions regarding the CE or directors (including Chair) to another person with authority to act (staff also have access to our auditor).”
“Being small makes it even more important that we have a culture of absolute accountability and transparency.”
“CEO and Board Chair appear to be a close team.”
| Yes | No | Don’t know | Total Count | ||||
|---|---|---|---|---|---|---|---|
| Chief Executive Officer/Managing Director/Principal | 367 | 96% | 11 | 3% | 5 | 1% | 383 |
| Member of the senior executive/leadership team or equivalent | 437 | 89% | 35 | 7% | 20 | 4% | 492 |
| Line manager (if not one of the above) | 176 | 80% | 22 | 10% | 23 | 10% | 221 |
| Administration/Support Services | 185 | 92% | 5 | 2% | 11 | 5% | 201 |
| Operational staff (e.g. Teacher, Analyst, Advisor, Technician, Officer, Engineer, Accountant) | 117 | 85% | 7 | 5% | 13 | 9% | 137 |
| Total | 1,282 | 89% | 80 | 6% | 72 | 5% | 1,434 |
| Yes | No | Don’t know | Total | ||||
|---|---|---|---|---|---|---|---|
| Central Government | |||||||
| Autonomous Crown Entities | 50 | 93% | 2 | 4% | 2 | 4% | 54 |
| Central Government - Other | 44 | 96% | 0 | 0% | 2 | 4% | 46 |
| Crown Agents or Companies | 81 | 93% | 5 | 6% | 1 | 1% | 87 |
| Crown Research Institutes | 33 | 87% | 2 | 5% | 3 | 8% | 38 |
| District Health Boards | 59 | 84% | 5 | 7% | 6 | 9% | 70 |
| Government Departments | 126 | 86% | 10 | 7% | 11 | 7% | 147 |
| Independent Crown Entities | 34 | 92% | 0 | 0% | 3 | 8% | 37 |
| Māori Trust Boards | 8 | 73% | 3 | 27% | 0 | 0% | 11 |
| Rural Education Activities Programmes | 10 | 91% | 1 | 9% | 0 | 0% | 11 |
| State-Owned Enterprises | 44 | 92% | 2 | 4% | 2 | 4% | 48 |
| Tertiary Education Institutions | 76 | 84% | 11 | 12% | 4 | 4% | 91 |
| Sub-Total | 565 | 88% | 41 | 6% | 34 | 5% | 640 |
| Yes | No | Don’t know | Total | ||||
|---|---|---|---|---|---|---|---|
| Local Government | |||||||
| Airports | 16 | 84% | 1 | 5% | 2 | 11% | 19 |
| Council Controlled Organisations or Council Controlled Trading Organisations | 67 | 89% | 3 | 4% | 5 | 7% | 75 |
| Energy Companies | 26 | 93% | 1 | 4% | 1 | 4% | 28 |
| Fish and Game Councils | 8 | 100% | 0 | 0% | 0 | 0% | 8 |
| Licensing and Community Trusts | 7 | 78% | 2 | 22% | 0 | 0% | 9 |
| Local Authorities | 135 | 80% | 18 | 11% | 16 | 9% | 169 |
| Local Government - Other | 9 | 82% | 1 | 9% | 1 | 9% | 11 |
| Port Companies | 2 | 67% | 0 | 0% | 1 | 33% | 3 |
| Sub-Total | 270 | 84% | 26 | 8% | 26 | 8% | 322 |
| Schools | 447 | 95% | 13 | 3% | 12 | 3% | 472 |
| Total | 1,282 | 89% | 80 | 6% | 72 | 5% | 1,434 |

