Appendix 1: About the state highway network
At 10,908 kilometres, the state highway network (the network) covers the length of New Zealand. The rural part of the network is made up mainly of two-lane sealed highways, with some sections of multi-lane highway and motorway.
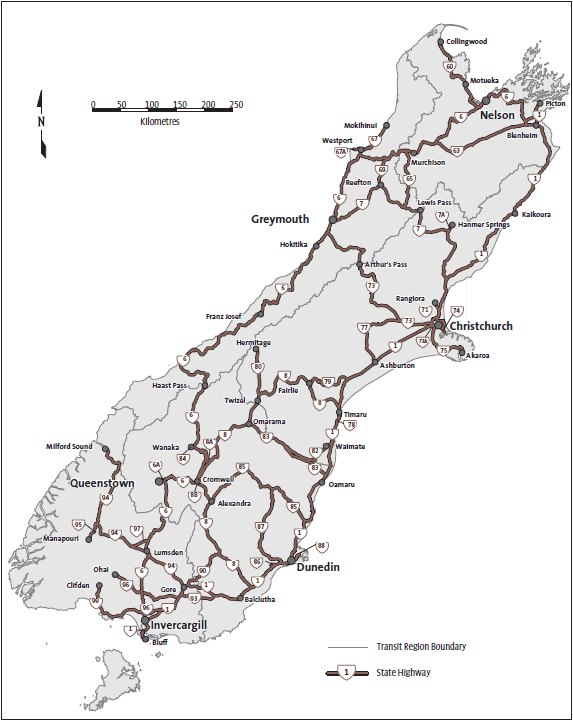
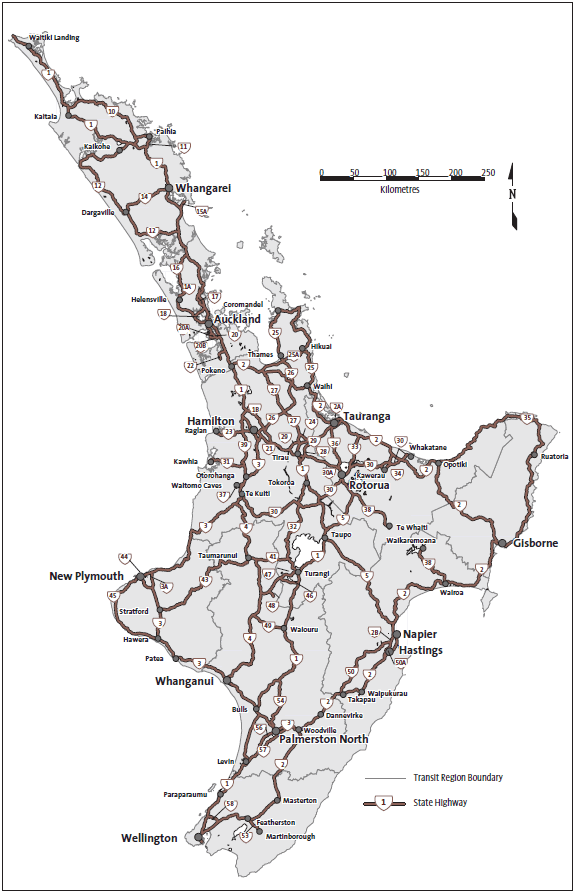
The urban network varies. It includes two-lane urban carriageways, multi-lane carriageways, and multi-lane motorway systems in Auckland, Wellington, Christchurch, and Dunedin. Figure 5 (continued overleaf) shows a map of the network.
Figure 5
Map of the state highway network


The network is made up of a large number of assets. NZTA classes these assets under three broad groupings – structural assets, corridor assets, and land and buildings.
Structural assets are those that are designed using engineering principles to sustain the physical loading imposed by traffic. Corridor assets are needed for the safe operation of the network. The land and buildings grouping includes road reserve land and property held for future capital works. Figure 6 sets out the network asset definitions by group, type, and component.
Figure 6
The state highway network asset groups, types, and components
| Asset group | Asset type | Asset component |
|---|---|---|
| Structural assets | Pavements | Formation (foundation) Pavement layers |
| Surfacings | Pavement surface | |
| Drainage | Culverts (<3.4m2 cross-sectional area) Surface water channels |
|
| Structures | Bridges Culverts (≥3.4m2 cross-sectional area) and underpasses Other structures (for example, retaining walls, sign gantries, tunnels, and major drainage structures) |
|
| Corridor assets | Carriageway lighting | Lighting |
| Traffic services | Intelligent traffic systems Traffic signals Automated traveller information systems Traffic signs Guardrails and delineation devices Road marking Roadside features (for example, rest areas) |
|
| Land and buildings | Land Property |
Road reserve (land) Property (held for future capital works) |
In 2009, NZTA estimated the replacement cost of the network at $28.896 billion. Figure 7 outlines, by asset component, details of the replacement cost of the network.
Figure 7
The replacement costs, by asset component, of the state highway network
| Component | Replacement cost ($million) |
|---|---|
| Land | 8,673 |
| Formation | 6,461 |
| Pavement (other) | 3,915 |
| Pavement surface | 1,044 |
| Drainage | 992 |
| Traffic facilities | 1,242 |
| Bridges | 5,140 |
| Culverts and underpasses | 425 |
| Other structures | 989 |
| Bailey bridges | 15 |
| Total | $28,896 |
Source: NZTA.
In 2009/10, the total cost for maintaining and operating the network was about $514 million.
For 2009/10, the National Land Transport Programme 2009-2012 allocated a total of $527 million for state highway road maintenance, renewal, and operations. This included $15 million allocated from the Government's economic stimulus package to further support an increased pavement renewals programme in 2009/10.
For the next three years, the National Land Transport Programme 2009-2012 reduced expected funding for maintenance and renewal of the network from $527 million in 2009/10 to $502 million in 2011/12.
page top
