Part 4: Trends in fatal truck crashes
4.1
The Police have been given additional resources to put the Committee’s recommendations into action, and have restructured their operations to provide more effective enforcement. Safety agencies have taken other initiatives to improve truck safety. So, has the number of fatal truck crashes fallen since 1996?
4.2
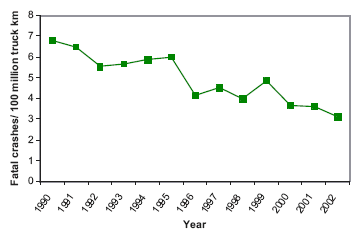
Figure 11 shows that fatal truck crashes per 100 million kilometres travelled dropped significantly in 1996, rose again in 1997 and 1999, and has declined since then. Overall, there appears to be a significant downward trend since 1990.
Figure 11
Fatal truck crashes per 100 million kilometres travelled

Source: LTSA
4.3
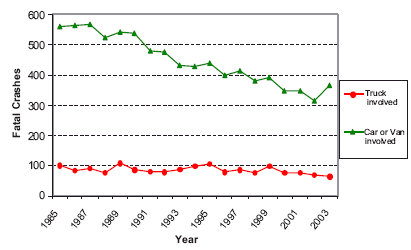
Figure 12 on the opposite page shows that the number of fatal truck crashes has fallen since 1985, but not as sharply as the number of fatal car or van crashes. A report prepared for the LTSA in 2003 noted that truck crashes in New Zealand accounted for about 20% of all road fatalities and 7.5% of all injuries. Truck travel was then increasing at about 6% annually, compared with 3% for other vehicles. According to the authors, this made the task of reducing truck crash fatalities “even more difficult.”
Figure 12
Fatal motor vehicle crashes since 1985

Source: LTSA
Our findings
4.4
The data shows a reduction in fatal truck crashes since 1985, which can probably be attributed to the greater emphasis that safety agencies and the road transport industry are putting on truck safety. However, truck travel is increasing at a faster rate than travel by other vehicles. These facts suggest that continued attention must be given to ways of reducing truck crashes.
