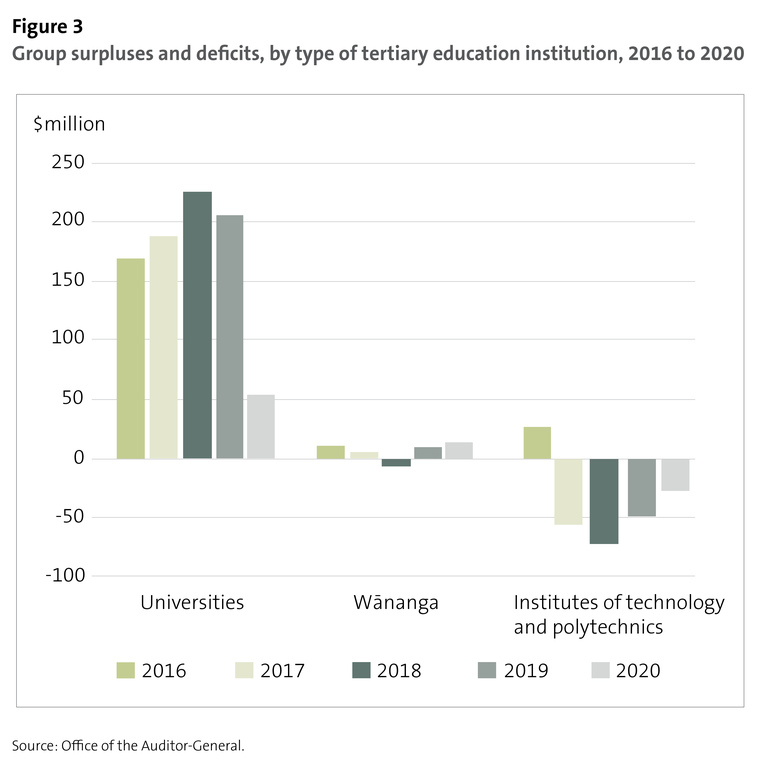
Figure 3: Group surpluses and deficits, by type of tertiary education institution, 2016 to 2020
Figure 3: Bar chart showing group surplus and deficit results for tertiary education institutions from 2016 to 2020. Surplus result decreased significantly for universities in 2020 compared with 2019. Surplus result increased slightly for Wānanga in 2020 compared with 2019. Deficit result reduced for institutes of technology and polytechnics in 2020 compared with 2019.
https://oag.parliament.nz/2022/tei-2021-audits/media-kit/figure3.png/view
https://oag.parliament.nz/2022/tei-2021-audits/media-kit/figure3.png/@@download/image/figure3.png
Figure 3: Group surpluses and deficits, by type of tertiary education institution, 2016 to 2020
Figure 3: Bar chart showing group surplus and deficit results for tertiary education institutions from 2016 to 2020. Surplus result decreased significantly for universities in 2020 compared with 2019. Surplus result increased slightly for Wānanga in 2020 compared with 2019. Deficit result reduced for institutes of technology and polytechnics in 2020 compared with 2019.


