Part 2: Profitability trends
2.1
In this Part, we discuss:
- the consolidated profitability results of port companies;
- that port companies as a whole are profitable;
- that there were significant movements in dividends; and
- variability in port companies' return on equity.
2.2
As noted in paragraphs 1.11 to 1.17, the port companies vary significantly in their ownership, size and scale, and operations. This limits how much comparative analysis we can do.
Consolidated profitability results of the port companies
2.3
We analysed the consolidated financial information of the port companies for 2015/16 to 2019/20. The consolidated financial information includes the port companies' wider business, not just the results for the core port operations.
2.4
Figure 1 shows the main profitability information the port companies reported.
Figure 1
Main port company profitability results, 2015/16 to 2019/20
| 2019/20 | 2018/19 | 2017/18 | 2016/17 | 2015/16 | |
|---|---|---|---|---|---|
| Revenue ($million) | 1,426.8 | 1,425.1 | 1,275.7 | 1,261.7 | 1,045.9 |
| Net profit after tax ($million) | 247.1 | 395.6 | 347.2 | 320.7 | 209.9 |
| Net profit as a percentage of revenue* | 17.3% | 27.8% | 27.2% | 25.4% | 20.1% |
| Net profit as a percentage of equity* | 5.8% | 9.5% | 8.8% | 9.0% | 6.2% |
| Dividends ($million) | 200.4 | 287.9 | 236.5 | 225.0 | 173.9 |
| Dividends as a percentage of equity* | 4.7% | 6.9% | 6.0% | 6.3% | 5.1% |
*The net profit and dividend percentages are calculated on total net profit and total dividends for all port companies compared with total revenue and total equity.
Note: Port companies use either a 30 June or a 30 September year-end for financial reporting purposes. We have made no adjustment for the different financial year-ends in Figure 1.
Source: We sourced the dollar amounts from the annual reports of the 12 port companies.
Port companies as a whole are profitable
2.5
Figure 1 shows that port companies as a whole reported increasing revenue and profits from 2015/16 to 2018/19. The port companies also provided an increasing level of dividends (in dollar terms) to their shareholders.
2.6
However, this trend changed in 2019/20. Although revenue increased by less than $2 million compared to 2018/19 (0.1%), net profit after tax decreased by $148.5 million (37.5%) and dividends paid to shareholders decreased by $87.5 million (30.4%).
2.7
From our analysis of port companies' audited financial statements, the change in 2019/20 was not primarily caused by Covid-19 (we discuss the effects of Covid-19 on port companies in Part 4). Instead, significant one-off events affected individual port companies and, in turn, the port sector. We discuss them below.
Lyttelton Port Company Limited
2.8
In 2015/16, Lyttelton Port Company recognised an impairment expense of $99.5 million, which led to it recording an after-tax loss of $59.8 million. The impairment expense arose because the return generated by replacing assets damaged by the Canterbury earthquakes, and some new capital expenditure to meet expected growth, did not meet the investment return established by the then directors of Lyttelton Port Company.11
2.9
In 2019/20, Lyttelton Port Company changed how it measured the value of its property, plant, and equipment. Accounting standards12 allow companies to measure their assets at cost (reduced for accumulated depreciation and impairment) or fair value (in effect, the amount someone else would pay for the asset).
2.10
In previous years, Lyttelton Port Company had measured its property, plant, and equipment at cost. However, in 2019/20, it changed its approach to measuring property, plant, and equipment from cost to fair value.
2.11
As a consequence, Lyttelton Port Company recognised a fair value asset reduction of $190.5 million, which led to an after-tax loss of $152.7 million. We highlighted this reduction in our audit report and referred readers to the disclosures Lyttelton Port Company made in its audited financial statements, which provided more information about how the reduction was determined.
2.12
We discuss the reasons for these asset write-downs in paragraphs 3.18 to 3.27.
CentrePort Limited
2.13
The Kaikōura earthquake of 14 November 2016 caused significant damage to CentrePort Limited's property and infrastructure assets and commercial properties. This had two main effects on CentrePort's financial results from 2016/17 to 2019/20.
2.14
First, CentrePort recognised revenue related to its insurance claims. At the time of the earthquake, CentrePort had cover for material damage and business interruption of up to $600 million for its port property and infrastructure assets. It also had cover of up to $276 million for its commercial property portfolio.
2.15
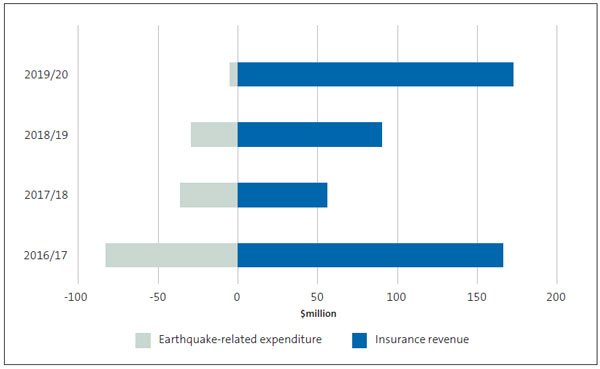
Between 2016/17 and 2019/20, CentrePort recognised insurance revenue of $484.5 million (see Figure 2).13 CentrePort's insurance claim was finalised in 2019/20.
2.16
Secondly, CentrePort recognised earthquake-related expenditure. This expenditure related to the impairment of assets damaged in the earthquake, as well as temporary costs incurred to repair assets or demolish assets that it no longer needed. CentrePort recognised $154 million of these types of costs between 2016/17 and 2019/20 (see Figure 2).
Figure 2
CentrePort's recognised insurance revenue and earthquake-related expenditure, 2016/17 to 2019/20

Source: CentrePort's 2016/17 to 2019/20 annual reports.
2.17
In our 2019/20 audit report, we referred readers to the disclosures CentrePort made in its audited financial statements that discussed the impact of the 2016 Kaikōura earthquake on the company, summarised the insurance claim settlement, and summarised the impacts on other parts of the financial statements, including income tax.14
There were significant movements in dividends
2.18
Dividends that port companies pay have been subject to some significant changes:
- in 2016/17, dividends increased by 29% to $225.0 million;
- in 2018/19, dividends increased by 22% to $287.9 million; and
- in 2019/20, dividends decreased by 30% to $200.4 million.
2.19
The increase in 2016/17 was mainly from a special dividend that Port of Tauranga paid to its shareholders. This was done as part of a capital restructure that aimed to return funds to shareholders over four years.
2.20
The increase in 2018/19 was primarily because Port of Napier declared a special dividend to its then shareholder Hawke's Bay Regional Investment Company Limited. This occurred before Napier Port Holdings Limited listed and became the owner of Port of Napier.
2.21
The decrease in 2019/20 was primarily because:
- the previous year included the special dividend paid by Port of Napier; and
- Ports of Auckland did not pay a dividend in 2019/20, a decrease of $45.9 million compared with the previous year. Ports of Auckland had agreed with its shareholder to reduce its dividend while it invested significantly in changing its business operations. For 2019/20, the dividends were set at 20% of after-tax profits.
2.22
Ports of Auckland declared a $4.9 million dividend for 2019/20, which was paid in 2020/21.
Why there is variability in port companies' return on equity
2.23
We wrote a letter to all chief executives and chairpersons of port companies in 2018 about the results of our 2016/17 audits.15 In that letter, we noted our concerns about the variability in how individual port companies report their returns. These concerns remain.
2.24
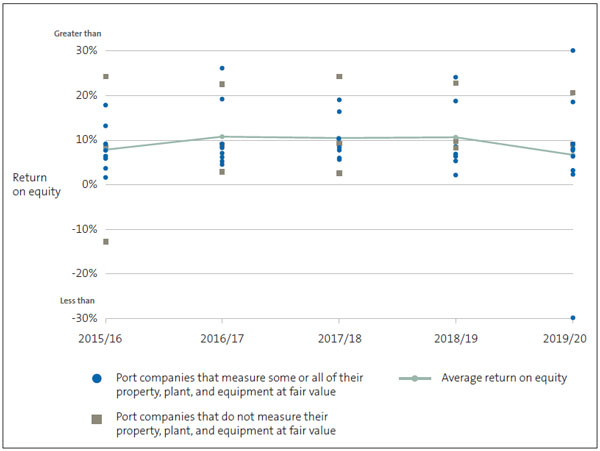
Figure 3 summarises the return on equity for all the port companies for 2015/16 to 2019/20. We have also included the average return on equity.16 The average return on equity has ranged between 6.6% (in 2019/20) and 10.8% (for 2016/17), with the lower returns coinciding with the large financial losses recognised by Lyttelton Port Company. However, Figure 3 also shows considerable variability between port companies in any given year.
Figure 3
Port companies' reported return on equity, 2015/16 to 2019/20

Source: Analysis by the Office of the Auditor-General.
2.25
There are three main reasons why there is variability in the returns made by port companies:
- Some port companies are more profitable.
- Some of the variability is because of one-off events, such as asset write-downs. These one-off events have affected only two port companies (see paragraphs 2.8-2.17).
- Some of the variability in the reported returns is because the port companies have different approaches to measuring the value of their property, plant, and equipment. These variations arise because accounting standards allow different approaches to be adopted in different circumstances. Paragraph 2.9 provides an example of this.
2.26
The first two reasons are because of how the port company operates. The third reason is because of the accounting policies the port company chooses.
2.27
Of the 12 port companies, 10 measure at least some asset classes at fair value. However, these 10 port companies do not consistently measure the same asset classes at fair value. In nine cases, the fair value is not based on the expected cash flows the assets can generate.
2.28
We remain concerned that these different approaches to measuring the value of property, plant, and equipment make the performance of port companies less transparent to stakeholders, Parliament, and the public. This means that it is difficult to assess the performance of the individual port companies and the port sector as a whole.
2.29
We consider that it is more appropriate to use fair value in operational asset valuations and to assess the fair value based on the expected cash flows to be generated. This will provide up-to-date financial information to stakeholders and make the port sector's performance more transparent.
2.30
In our 2018 letter to chief executives and chairpersons of port companies, we urged port companies to review how they measure the value of their property, plant, and equipment.17 Lyttelton Port Company followed our suggestion and now measures its property, plant, and equipment at fair value, based on the expected cash flows the assets can generate. We are aware that another port company has been considering a similar change.
2.31
We continue to encourage port companies to review how they measure the value of their property, plant, and equipment.
11: Our 2015/16 audit report referred readers to the disclosures Lyttelton Port Company made in its audited financial statements that provided more information about how the impairment was determined.
12: The relevant accounting standard is New Zealand Equivalent to International Accounting Standard 16: Property, Plant and Equipment (NZ IAS 16).
13: CentrePort's associate property entities recognised $163 million in insurance revenue from their insurance claims. The claims were for damage to commercial property buildings that were owned by the associate property entities.
14: In our 2016/17, 2017/18, and 2018/19 audit reports, we referred readers to the disclosures the company made in its audited financial statements describing the impact of the 2016 Kaikōura earthquake on the company.
15: See Port companies: Matters arising from our 2016/17 audits, dated 19 June 2018, on our website, oag.parliament.nz.
16: In this paragraph and in Figure 3, "return on equity" has been calculated as the average of all the port companies' individual returns on equity.
17: See Port companies: Matters arising from our 2016/17 audits, dated 19 June 2018, on our website, oag.parliament.nz.

