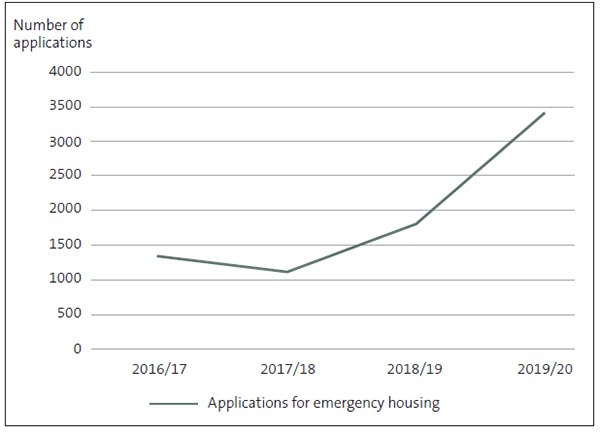
Figure 1: The number of applications for emergency housing in Auckland, 2016/17-2019/20
Line graph showing the number of applicants for emergency housing in Auckland from the years two thousand and sixteen slash seventeen to two thousand and nineteen slash twenty. The graph shows that the number of applicants increased from one thousand seven hundred and ninety-nine applicants in two thousand eighteen slash nineteen to three thousand three hundred and ninety-one applicants in two thousand nineteen slash twenty.
https://oag.parliament.nz/2021/inquiry-emergency-housing/gfx/figure1.jpg/view
https://oag.parliament.nz/2021/inquiry-emergency-housing/gfx/figure1.jpg/@@download/image/figure1.jpg
Figure 1: The number of applications for emergency housing in Auckland, 2016/17-2019/20
Line graph showing the number of applicants for emergency housing in Auckland from the years two thousand and sixteen slash seventeen to two thousand and nineteen slash twenty. The graph shows that the number of applicants increased from one thousand seven hundred and ninety-nine applicants in two thousand eighteen slash nineteen to three thousand three hundred and ninety-one applicants in two thousand nineteen slash twenty.


