Part 3: Risks could be better managed
3.1
In this Part, we look at how the Agency manages strategic risks. We discuss:
- performance data and what it suggests about overall road condition;
- risks to market competition that have not eventuated; and
- the need for the Agency to better monitor strategic risks.
3.2
We expected the Agency to identify and manage the main risks to it achieving the benefits and outcomes it expected from maintaining state highways through the Network Outcomes Contract model. We also expected the Agency to have a good understanding of, and monitor, the strategic risks to maintaining the state highway network.
3.3
By identifying and monitoring the strategic risks, the Agency can take steps to reduce the likelihood of these risks to the safety, reliability, and resilience of state highways.
Summary of findings
3.4
Although the Agency has a national risk register that brings together some reputational and operational risks, it could do more to aggregate the risks each contract team identifies into a national view. This could help to identify strategic risks to the effectiveness and efficiency of the Network Outcomes Contract model.
3.5
We recommend that the Agency identify, mitigate, monitor, and report on the strategic risks in maintaining the state highway network.
3.6
During our audit, we identified three strategic risks to the Agency properly maintaining state highways that it needs to monitor and manage. These are:
- maintaining road condition (see paragraphs 3.7 to 3.23);
- ensuring market competition (see paragraphs 3.24 to 3.35); and
- retaining the right capability and capacity to manage the contracts (see paragraph 4.18 to 4.21).
Risks to maintaining the road condition for the longterm
3.7
We asked Agency staff, suppliers, local council staff, and subcontractors about changes in the condition of state highways since the Agency introduced the contracts. Most thought the condition of the roads had worsened or was about to become worse.
3.8
We also wanted to understand what road users thought about the condition of the state highways so we talked to representatives from the Road Transport Association New Zealand and the New Zealand Automobile Association (the AA). Both representatives said that the condition of state highways has worsened over time. One remarked that roads that have high use have more wear and tear and that the roading surface breaks down more regularly than in the past.
3.9
The AA also gave us the results of a March 2019 survey of its members and feedback from all 17 AA districts. The survey found that about 28% of AA members thought road quality was either poor or substandard. Potholes on the roads was the second most common roading concern for AA members.
3.10
Most AA districts reported that the condition of state highways in their district was getting worse. This affects car maintenance, including windscreen damage from loose chip seal and damage to tyres and suspension from potholes.
3.11
We analysed the Agency’s road condition data for state highways against the Agency’s annual performance measures for the outcomes of safe stopping (measured by looking at skid threshold and surface texture), smoothness (measured by looking at the smoothness of travel on state highways), and network resilience (measured by looking at rutting).
3.12
Our analysis shows that the state highways covered by the contracts have mostly met these road condition indicators, but there are early signs that the road condition of some state highways is worsening.
3.13
Figure 9 shows that the number of contract regions meeting the Agency’s annual performance measure for the percentage of travel on state highways above skid threshold has decreased overall since 2013/14.9
3.14
The Agency told us that increased traffic volume can affect performance against this measure, and that it manages the risk to this aspect of road condition by using skid threshold indicators to prioritise investment.
Figure 9
Number of contract regions meeting the standard for the percentage of travel on state highways above the skid threshold, from 2013/14 to 2019/20
The bar chart shows that, over the last seven years, an increasing number of regions are below the expected 98% performance standard.

Source: Office of the Auditor-General, using data from the New Zealand Transport Agency.
3.15
Similarly, Figure 10 shows the number of contract regions meeting the Agency’s annual performance measure for the percentage of travel on state highways classed as smooth. Although most contract regions are meeting this measure, since 2013/14, the performance of some contract regions has declined.
Figure 10
Number of contract regions meeting the measure for percentage of travel on state highways classed as smooth, from 2013/14 to 2019/20
The bar chart shows a slow increase in the low number of contract regions where performance is not meeting the Agency’s performance standard of 97%.

Source: Office of the Auditor-General, using data from the New Zealand Transport Agency.
3.16
Most contract regions are meeting the Agency’s annual road condition measure for the percentage of rutting more than 20 millimetres over the state highway network. However, the results also show a declining trend.
3.17
The number of contract regions meeting the Agency’s annual measure for the percentage of network meeting surface texture standards has generally been the same from 2013/14 to 2019/20.
3.18
Several factors contribute to a worsening road condition. The Agency told us that previously it was over-investing in the condition of the network and exceeding performance targets. The Agency said that some of the reduction in the condition of the state highway network was anticipated, and a result of its new approach to maintenance and renewals (discussed in paragraphs 2.45 to 2.55), which is now more focused on investing at the right time, in the right place. The new approach led to the Agency deferring some renewals. Because the number of roads resurfaced or rehabilitated has decreased, suppliers are doing more patching repairs. This results in the roads being rougher.
3.19
Another factor is the Agency implementing the One Network Road Classification. This put all roads into different classes. Some of the performance measures and indicators in the contracts are based on the reclassification of roads. For example, depending on the road classification, contract teams can have up to six potholes that are more than 150 millimetres wide on a five-kilometre section of road and still meet minimum standards under the current contracts. These measures can influence some decisions that the contract teams make (for example, on the timing of maintenance activities), and do not necessarily align with the expectations of road users. For some state highways, this has meant changes to the standard of maintenance.
Need to ensure enough investment in renewals
3.20
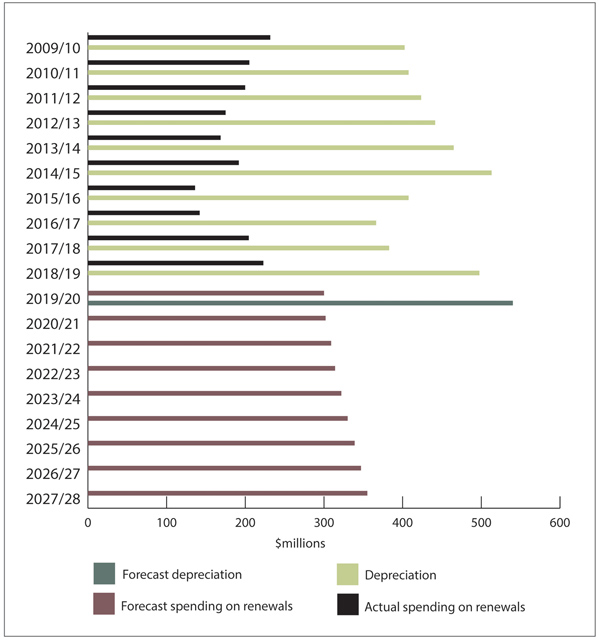
We are concerned that the Agency appears to be spending less than depreciation on renewals. This could affect the condition of state highways in the long term. Depreciation is an estimate of the portion of the asset that was “used up” during the year, and we would normally expect the rate of renewals to match the rate of depreciation. Figure 11 shows that, between 2009/10 and 2018/19, the Agency has consistently spent less on renewing state highways than depreciation. This is expected to continue for the foreseeable future.
3.21
The gap between spending on renewals and depreciation could indicate that the state highway network is wearing out faster than the Agency is renewing it.
Figure 11
Actual and estimated spending on renewals compared with depreciation, from 2009/10 to 2027/28
The bar chart shows the Agency has consistently spent less on renewing state highways than depreciation, and forecasts show this pattern is likely to continue.

Source: Office of the Auditor-General, using data from the New Zealand Transport Agency.
Note: The New Zealand Transport Agency does not have a formal 10-year forecast for depreciation.
3.22
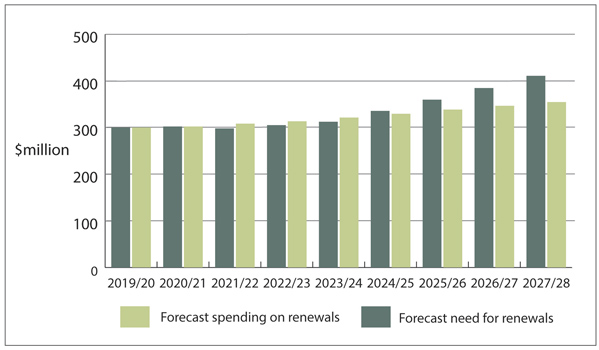
The Agency’s own forecasts in Figure 12 show an increasing gap between the level of renewals needed and the Agency’s budgeted spending on renewals from 2024/25 onwards. The Agency is allocated funds for its activities through the Government Policy Statement on Land Transport and the National Land Transport Plan. This determines how much it can invest in renewing and maintaining state highways. The Agency has highlighted that additional investment in the network will be required as part of developing the next Government Policy Statement on Land Transport.
Figure 12
New Zealand Transport Agency’s forecast need for renewals, and budgeted spending on renewals, from 2019/20 to 2027/28
The bar chart shows a slowly widening gap from 2024/25 onwards between the forecast need for renewals and the forecast spending on them.

Source: Office of the Auditor-General, using data from the New Zealand Transport Agency.
3.23
Although the Agency needs to balance network investment with ensuring appropriate road condition, if the projections are soundly based and nothing changes, the condition of state highways will get worse over time. In our view, the Agency needs to actively manage this risk and ensure that it is investing enough in renewals to maintain state highways that are safe, reliable, and resilient.
Risk to market competition has not eventuated
3.24
One of the main risks identified when the Agency introduced the Network Outcomes Contract model was the potential for market competition to decrease because the contracts were larger and for a longer term. The risk was that the Agency would end up relying on a small number of suppliers to maintain state highways and that other companies would not be able to compete for the contracts. Eventually, the Agency could pay more to maintain state highways because of a lack of competition.
3.25
Based on the information we have available, the risk to market competition from introducing the contracts has not eventuated. The Agency has achieved its market competition goals and suppliers, through their contract teams, are meeting their requirements to support subcontractors. However, the risk remains, and we consider that the Agency needs to continue to monitor it.
Market competition goals have been achieved
3.26
When the Agency introduced the new contracting model, it wanted to encourage more competition in the maintenance and operations market. At the time, the Agency had two main suppliers for physical works on the state highways and one main supplier for professional services. The Agency’s goals were:
- at least four suppliers, with two or more contracts each, representing roughly 10% by value of the total maintenance and operations budget for state highways;
- at least three tenderers for each contract; and
- a minimum of three professional consultants involved in three or more contracts each.
3.27
The Agency has achieved these goals. Currently, four suppliers have two or more contracts (including the alliance contract to maintain state highways in Auckland) and two suppliers have one contract each.
3.28
From 2013 to 2019, the Agency received three or more tenders for more than 80% of the contracts awarded. This means the Agency received its desired number of tenders for most of the contracts. We have also identified that at least three professional consultants were involved in three or more contracts and one was involved in two contracts.
3.29
To understand changes in the market, at a high level, we compared the market share of the top three suppliers of state highway maintenance and operations work in 2011 and our estimated market shares for 2018/19 (after all the contracts had been awarded).10
3.30
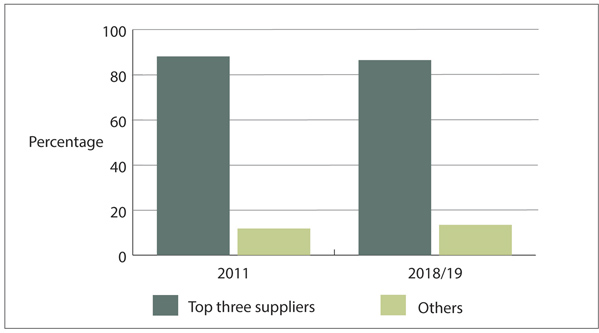
As Figure 13 shows, the market share of the top three suppliers has not changed significantly. This suggests that the larger suppliers are not becoming more dominant in the market.
Figure 13
Market share of the top three suppliers in 2011 and 2018/19
The bar chart shows that the top three suppliers had a little under 90% of the market share in 2011, and this had barely changed by 2018/19.

Source: Office of the Auditor-General, using data from the New Zealand Transport Agency.
Note: When analysing the market share, we have credited the supplier that holds the maintenance contract with the full spending for all activities.
Suppliers are meeting their requirements to support subcontractors
3.31
The Agency took several actions to reduce the market competition risk, including:
- allowing professional consultants and suppliers to be involved in more than one bid for each contract but to be the lead in only one bid;
- requiring each bid to provide work for subcontractors up to a minimum level depending on the road maintenance market for each contract, with a default minimum of 20%;
- requiring suppliers to state how they will support a competitive market as part of the bidding process – for example, by helping subcontractors become pre-qualified so they can bid for larger contracts; and
- monitoring market behaviour and competition during the tender phase, including sustainability of tender pricing and effects on market share.
3.32
Through their contract teams, suppliers are meeting the Agency’s requirements to support subcontractors. We reviewed the percentage of work suppliers subcontracted. For 2016/17 and 2017/18, the contract teams have subcontracted more than the 20% minimum required by the Agency.
3.33
For the same period, we identified only one instance where a contract team did not subcontract the minimum overall percentage of work it pledged to. That contract team later received a poor performance score for the relevant key performance indicator.
3.34
The Agency also monitors suppliers’ performance in delivering on their “healthy market” pledges through their contract teams. The pledges require suppliers to specify how much work they will give to subcontractors overall and how much they will give to specified subcontractors. The pledges also cover activities the supplier has said it would do to support a sustainable market, such as increasing the capability of subcontractors.
3.35
Our analysis of the key performance indicator results show that many suppliers are meeting the healthy market pledges and contributing to a healthy subcontractor market for road maintenance.
Strategic risks need to be better monitored
3.36
Currently, each contract team (made up of staff from the Agency, suppliers, and subcontractors) identifies and manages risks to the state highways in their region, and risks to the success of the contract. For example, the West Waikato North contract team identified the risk of increased maintenance demand because of the premature failure of the pavement or road surface.
3.37
The Agency has a national risk register that brings together some reputational and operational risks. However, the Agency could do more to aggregate the strategic risks each contract team identifies into a national view, and to cover strategic risks to the effectiveness and efficiency of the Network Outcomes Contract model. By more systematically identifying and monitoring strategic risks, the Agency can reduce the likelihood of those risks affecting the safety, reliability, and resilience of state highways.
| Recommendation 2 |
|---|
| We recommend that the New Zealand Transport Agency identify, mitigate, monitor, and report on the strategic risks from maintaining the state highway network to reduce the likelihood of those risks affecting the safety, reliability, and resilience of state highways. |
3.38
During our audit, the Agency formed a Maintenance Contracts Governance Group to help improve its oversight and management of strategic risks for all maintenance contracts. The Agency told us that the Maintenance Contracts Governance Group has been structured to measure and report on strategic risks to the Agency and the industry, including resource, funding, market competition, and performance.
9: Different road conditions can affect the distance required for a braking vehicle to stop. In 2017/18, 17 contract regions did not meet the performance measure for good skid threshold. Agency-commissioned research found that this increase was caused by the unusually hot summer in 2017/18, rather than any decrease in the condition of the road.
10: The New Zealand Commerce Commission uses this measure to understand the market concentration of an industry.

