Figure 1
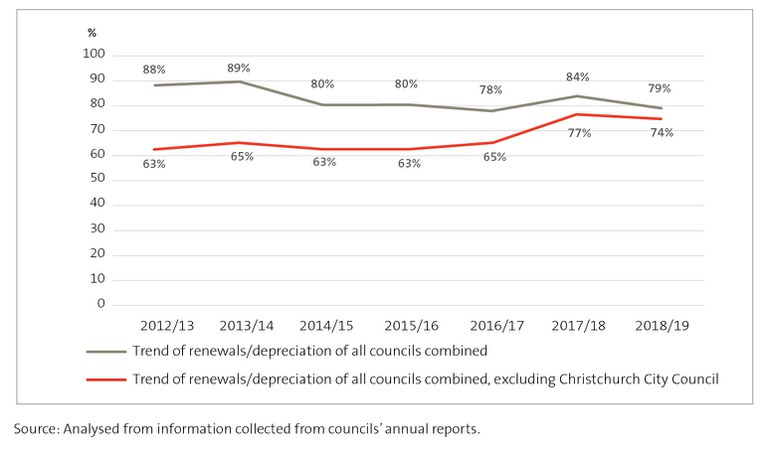
Renewal capital expenditure compared with depreciation for all councils, 2012/13 to 2018/19. There are two lines on the graph. The green line includes all councils, and the red line excludes Christchurch City Council. Both lines show that renewal capital expenditure is less than depreciation for the period from 2012/13 to 2018/19, although there has been a significant improvement in councils’ renewal efforts since 2016/17.
https://oag.parliament.nz/2020/local-govt/media-kit/figure1.jpg/view
https://oag.parliament.nz/2020/local-govt/media-kit/figure1.jpg/@@download/image/figure1.jpg
Figure 1
Renewal capital expenditure compared with depreciation for all councils, 2012/13 to 2018/19. There are two lines on the graph. The green line includes all councils, and the red line excludes Christchurch City Council. Both lines show that renewal capital expenditure is less than depreciation for the period from 2012/13 to 2018/19, although there has been a significant improvement in councils’ renewal efforts since 2016/17.


