Part 3: Financial trends and insights
3.1
In this Part, we discuss the forecast financial information10 in the 2018-28 LTPs.11 We wanted to understand the trends in the forecast financial information.
3.2
The main trend we identified is significant forecast capital expenditure in the 2018-28 LTPs. Most of the councils' planned capital expenditure is to renew their assets. However, this amount remains less than forecast depreciation, indicating that councils as a whole might not be adequately reinvesting in their assets.
3.3
Most councils have assessed that they are in this position and have plans to manage their "renewals gap". Councils need to actively review these plans so that they will be able to adequately reinvest in their assets.
3.4
A large portion of forecast capital expenditure is on new infrastructure and to increase levels of service. Councils have to respond to growth and changes in levels of service, including regulatory changes. It is also important that they continue to renew and invest in their current infrastructure or risk that crucial infrastructure assets could start to fail.
3.5
Meeting proposed levels of service comes at a cost. Although councils have expressed a desire to keep rates at affordable levels, rates revenue is expected to increase by more than 50% in the next 10 years to fund proposed services. This increase is largely consistent with rates increases that were forecast in the 2015-25 LTPs.
3.6
There is also a sharp increase in expected debt to fund the anticipated growth. Some councils expecting high growth are starting to come up against debt covenants. Councils nearing such limits run the risk that they will not be able to respond to unexpected events because, if they occur, funding sources could be limited.
3.7
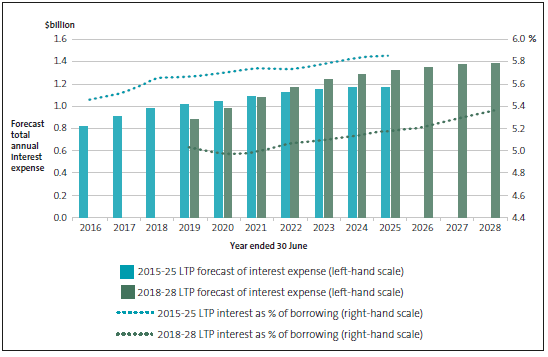
Councils' forecast interest expenditure is comparatively lower than the 2015-25 LTPs despite increased debt signalling lower interest rates. We are concerned by this trend. If interest rates increase more than anticipated, this could limit some councils' ability to service their debt and carry out their capital expenditure programmes without making other changes, such as increasing rates or reducing expenditure.
3.8
The Productivity Commission is currently inquiring into the adequacy and efficiency of the existing funding and financing options for councils and whether these are sustainable. We recommend that this review consider the trends and concerns we have raised.
How we completed our financial analysis
3.9
In our analysis, we considered the sector as a whole and as five sub-sectors. The sub-sectors we considered were:
- metropolitan councils;
- Auckland Council (considered separately from other metropolitan councils because of its size);
- provincial councils;
- regional councils; and
- rural councils.
3.10
We also considered the effect of population growth on councils and categorised councils as either "high-growth" or "low-growth".12
3.11
See Appendix 2 for more information on the sub-sectors and high-growth councils, and Appendices 3 to 7 for the forecast financial picture of the five sub-sectors.
Councils are forecasting higher spending
3.12
Compared with the financial forecasts for 2015-25, councils are forecasting to spend more to address greater demand on council services, improve levels of service, and carry out their normal operations.13 To fund this additional spending, councils are forecasting to increase revenue streams, such as rates, and to borrow more.
3.13
This trend is not new. However, the scale of change from the 2015-25 LTPs to the 2018-28 LTPs is new, especially the increase in forecast capital expenditure.
3.14
Figure 3 summarises the increases in councils' revenue, operating expenditure, and capital expenditure forecasts by comparing the 2018-28 LTPs' forecasts with the 2015-25 LTPs' forecasts. These movements are not uniform throughout all councils (see Appendices 3 to 7).
Forecast growth is not evenly spread
3.15
Some councils are having to plan for and manage large increases in the number of people who will live and work in their cities, districts, or regions. We have described the councils experiencing the largest population increase as "high-growth".
Figure 3
2018-28 forecast financial information compared with 2015-25 forecast financial information for all councils
| 2015-25 LTP $billion |
2018-28 LTP $billion |
% increase14 | |
|---|---|---|---|
| Operating revenue | 122.7 | 149.5 | 22 |
| Operating expenditure | 110.8 | 130.1 | 17 |
| Capital expenditure | 41.5 | 54.5 | 31 |
3.16
High-growth councils forecast larger increases compared with the 2015-25 LTPs than their low-growth counterparts (see Figure 4).
Figure 4
Comparison between 2018-28 forecast financial information and 2015-25 forecast financial information for high-growth and low-growth councils
| High-growth councils | Low-growth councils | |||||
|---|---|---|---|---|---|---|
| 2015-25 LTP $billion |
2018-28 LTP $billion |
% increase14 |
2015-25 LTP $billion |
2018-28 LTP $billion |
% increase14 |
|
| Operating revenue | 70.6 | 88.6 | 25 | 52.1 | 60.9 | 17 |
| Operating expenditure | 61.3 | 73.0 | 19 | 49.5 | 57.1 | 15 |
| Capital expenditure | 28.0 | 36.9 | 32 | 13.6 | 17.6 | 30 |
3.17
Some high-growth councils forecast large increases. For example, Queenstown-Lakes District Council and Tauranga City Council both forecast more than a 50% increase in operating revenue and operating expenditure compared with 2015-25. Both councils have more than doubled their forecast capital expenditure programme in their 2018-28 LTPs.
3.18
The forecast capital expenditure increases for the high-growth and low-growth councils shown in Figure 4 are similar. However, the high-growth councils have forecast 29% of their planned capital expenditure to allow for meeting increased demand. Low-growth councils expect some growth but, at 9% of their planned capital expenditure, it is far less. "Growth" capital expenditure is primarily funded by borrowing. Councils also have other funding sources for growth capital expenditure, such as subsidies from the New Zealand Transport Agency and by levying contributions from the developers wanting the capital expenditure.
3.19
We see two main risks that high-growth councils must manage.
3.20
The first risk is when to provide new assets to meet additional demand. If councils build assets too early, the cost to service the debt used to fund the assets will fall disproportionately on existing ratepayers. If they build assets too late, the services they provide to the community will be affected.
3.21
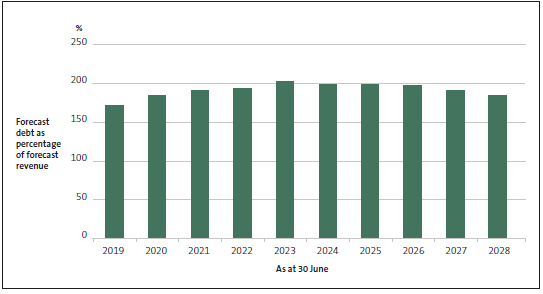
The second risk is funding the growth. High-growth councils need to borrow significantly to fund capital expenditure for new assets – the 2018-28 LTP forecasts show a 49% increase in debt from 2018/19 to 2027/28 for these councils. Figure 5 shows the forecast debt as a percentage of revenue for the 11 high-growth councils.15
Figure 5
Forecast debt as a percentage of total revenue for high-growth councils
The 2018-28 LTP forecasts show an increase in debt as a percentage of total revenue for high-growth councils, peaking in 2022/23.
3.22
Most high-growth councils have debt covenants that restrict their ability to borrow more than 250% of their revenue. Based on forecast debt levels, most high-growth councils generally do not have much borrowing capacity to respond to other risks. Increasingly, councils' ability to sustainably manage growth is becoming more at risk.
Councils face risks to their large forecast capital expenditure programme
3.23
As noted in Figure 3, councils have significantly increased the amount of planned capital expenditure in the latest LTPs compared with the 2015-25 LTPs. Figure 6 breaks down the forecast capital expenditure into three categories:
- expenditure for new assets to meet additional demand;
- expenditure to improve levels of service; and
- expenditure to replace or renew existing assets.
Figure 6
Forecast capital expenditure in the 2018-28 long-term plans compared with the 2015-25 long-term plans
| Capital expenditure | 2015-25 LTP $billion |
2018-28 LTP $billion |
% increase |
|---|---|---|---|
| Meet additional demand | 8.2 | 12.4 | 51 |
| Improve the level of service | 13.2 | 18.6 | 41 |
| Renew existing assets | 20.1 | 23.5 | 17 |
| Total | 41.5 | 54.5 | 31 |
3.24
Figure 6 shows that councils are progressively forecasting more capital expenditure to meet additional demand and improve service levels. As noted above, capital expenditure forecast to meet additional demand is concentrated in high-growth councils. Some councils included forecast capital expenditure to respond to the recommendations in the Report of the Havelock North drinking water inquiry: Stage 2, and to meet the expectations included in national policy statements.
3.25
The overall forecast capital expenditure increase compared with the 2015-25 LTP forecasts affects almost all councils. Appendices 3 to 7 show that all sub-sectors are forecast to increase their capital expenditure significantly. Only seven councils are forecasting a decrease in capital expenditure compared with their 2015-25 LTP forecasts.
3.26
Generally speaking, low-growth councils are increasingly turning their attention to renewing existing and ageing infrastructure. We consider this to be prudent and consistent with councils' stewardship responsibilities. On the other hand, high-growth councils are more focused on providing capital expenditure to meet anticipated demand. We discuss council renewals in paragraphs 3.34 to 3.44.
3.27
Achieving this forecast capital expenditure programme will be challenging. The capital expenditure programme is larger than what councils have forecast previously and also larger than what has been recently achieved.
3.28
From 2013/14 to 2016/17, councils overall have managed to spend between 66% and 78% of their planned capital expenditure budgets. Capital expenditure budgets during this period ranged from $3.2 billion (in 2013/14) to $4.9 billion (in 2015/16).
3.29
We consider that councils will need to carefully plan, prioritise, and monitor their budgets to have a realistic ability to achieve capital expenditure programme budgets. Councils will also need to consider whether they have the staff capacity and capability to manage their capital expenditure programme.
3.30
This is a matter of interest to us. Through our focus on public sector procurement practices, we plan to examine councils' capital procurement capacity and capability.16
3.31
In paragraphs 3.20 and 3.21, we noted that high-growth councils will need to carefully manage the pressures of growth. This is even more relevant for councils that have to manage growth in their cities, districts, or regions after a long period of no growth. Among other factors, these councils should consider whether they are applying the right funding tools (such as development contributions) to pay for growth-related capital expenditure.
3.32
New Zealand is a small country, and there are several other planned or occurring projects17 that will compete with councils for service from the construction industry. This could affect when councils complete their planned capital work and the cost of this work.
3.33
A new independent infrastructure body is being set up. We understand that this entity is likely to have a role in considering project delivery throughout the public and private sectors.
Councils need to better manage and reinvest in their existing assets
3.34
We have previously reported our concerns that many councils are not adequately reinvesting in their assets.18 To consider how councils are reinvesting in their assets, we compared renewal and replacement capital expenditure to depreciation. We consider depreciation to be the best available estimate of what portion of the asset was used up during the financial year.
3.35
When examining LTPs, we can get a better sense of how councils plan to manage their existing assets over time. A council that is spending less on renewing its assets compared to the depreciation expense will, at some point in the future, need to spend more to "catch-up" its asset reinvestment. The LTPs, and specifically the financial and infrastructure strategies, should explain what approaches councils will take to manage reinvestment in existing infrastructure.
3.36
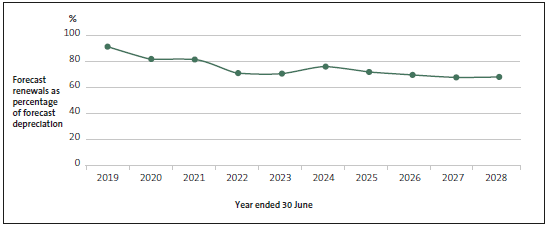
Figure 7 compares the forecast renewal capital expenditure to forecast depreciation for all councils. Forecast renewals remain less than forecast depreciation during the period of the LTP.
3.37
These are similar trends to those we have seen from analysing the 2012-22 and 2015-25 LTP figures.19 There are no significant differences when looking at sub-sectors or at high-growth and low-growth councils.
Figure 7
Forecast renewal capital expenditure compared with forecast depreciation for all councils
Forecast renewals remain less than forecast depreciation during the period of the LTP.
3.38
For councils' core assets, councils are forecasting renewals expenditure to be significantly above 100% of depreciation only in flood protection and control works. Other asset classes have the following averages:
- Roading – on average, forecast renewals are 83% of forecast depreciation.
- Water supply – on average, forecast renewals are 82% of forecast depreciation.
- Wastewater – on average, forecast renewals are 67% of forecast depreciation.
- Stormwater – on average, forecast renewals are 52% of forecast depreciation.
3.39
The trends shown by these forecasts reinforce our previous concerns that councils as a whole might not be reinvesting adequately in their assets.
3.40
Roading is the only major asset class to differ from trends we have seen previously. This is because metropolitan councils forecast to spend less on renewing roading assets than in previous LTPs.
3.41
From the work our auditors did, 44 councils identified a gap between forecast renewals and depreciation. Additionally, our auditors identified that not all councils formally analysed whether they had a "renewals gap". This is not good enough given the criticality of the infrastructure in question. All councils need to formally assess what stage in the life cycle their critical assets are at and plan accordingly.
3.42
Councils that have identified a renewals gap used one or more of the following approaches to manage the upcoming renewals peak:
- Putting in place funding sources to pay for the future renewals. The most common approach taken was levying rates to cover their depreciation expense and placing any rates that were not spent on renewals in reserve.
- Progressively increasing renewal expenditure over a period of time. Some councils are actively addressing a backlog of renewals on their major assets, leading to these councils significantly increasing their forecast renewals expenditure.
- Evening out the future renewals forecasts to "smooth" the expected peak.
- Increasing internal staff numbers to ensure that there are enough people to manage a larger capital expenditure renewals programme.
- Focusing on renewing critical assets first, so the most important parts of the council's asset network continue to deliver services.
3.43
Councils with a renewals peak to manage also planned to improve their knowledge of the condition and performance of their assets. This would give them better information to more accurately forecast when they need to renew assets.
3.44
From reviewing councils' financial and infrastructure strategies, we consider that councils could have been clearer about the approaches discussed in paragraph 3.42. We discuss our concerns about how councils set out the implications of their proposals in the financial and infrastructure strategies in Parts 4 and 5.
Priorities for councils when managing their assets
3.45
In general, councils are reporting in their infrastructure strategies a need to improve their asset condition and performance information, especially for assets used to supply three waters services (see also Part 5).
3.46
Councils are also using their incomplete knowledge of the condition and performance of their major assets to model renewal forecasts. Because the information they use is not as complete and robust as it should be, there is greater uncertainty about when assets need to be replaced or when the councils' renewal peaks will be.
3.47
We recommend that, to increase the reliability of future renewals forecasts and the associated funding needs, councils continue to prioritise their understanding of the condition and performance of their most important assets and use this updated information for planning.
3.48
A common comment we hear from councils is that they expect their major assets to last longer than the asset lives they assign to them. Councils use the asset lives to estimate their depreciation expense, which they recognise for financial reporting purposes and use in the LTP financial forecasts.
3.49
However, councils do not believe that they have enough knowledge about their assets to increase the asset life. As councils continue to improve the condition and performance of assets, they should prioritise work on confirming whether the asset lives they have assigned to their assets are accurate.
Councils' funding sources are continuing to increase
3.50
Councils' financial strategies discuss two major funding sources: rates revenue and borrowing.
Rates revenue
3.51
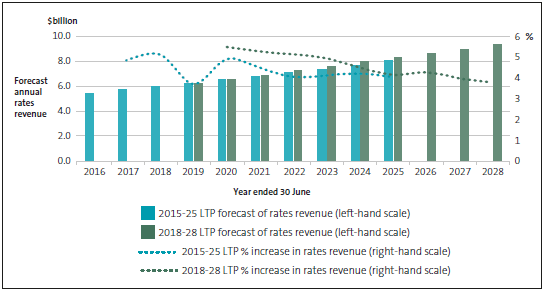
Figure 8 compares rates revenue forecast in the 2018-28 LTPs to what was forecast in the 2015-25 LTPs, for councils as a whole. Rates revenue is forecast to be $6.2 billion in 2018/19 and is forecast to increase to $9.3 billion in 2027/28. This is an increase of slightly more than 50% during the 10-year period. It is similar to the 2015-25 LTP forecasts, where councils forecast an increase of 47% in rates during the 10-year period.
3.52
Council rate increases are primarily because of three factors:
- to fund inflation (the cost of services increasing over time);
- to fund the cost of new services; and
- to reflect increased demand for services (this is relevant for growth councils).
3.53
Projected rates revenue in 2018/19 is similar to what was forecast in the 2015-25 LTPs. However, in the 2018-28 LTPs, rates are forecast to increase at a faster rate compared with the 2015-25 forecasts.
Figure 8
Rates revenue for councils as a whole, as forecast in the 2015-25 and 2018-28 long-term plans
In the latest LTPs, the projected rates revenue for 2018/19 is similar to what was forecast in the 2015-25 LTPs. For the following years, however, rates revenue is forecast to increase at a faster rate compared with the 2015-25 forecasts.
3.54
In their LTPs, councils consistently state that they want to provide affordable services. Figure 8 shows that councils overall forecast that annual rates increases are below 4% in only one year – 2027/28. The annual forecast rates increases in the current LTP forecasts are also higher than that forecast in the 2015-25 LTPs.
3.55
Some of the forecast annual rates increases will be because of growth and therefore more ratepayers. Most of these forecast rates increases will be charged to existing ratepayers.
Debt and borrowing
3.56
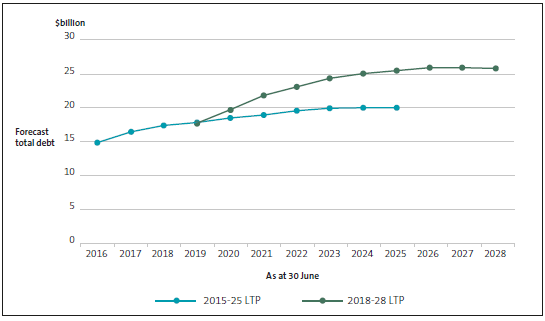
In the 2018-28 LTP forecasts, councils overall are forecasting to borrow about $5.4 billion more in 2024/25 compared with 2015-25 LTP forecasts (see Figure 9). This is despite the forecast debt position in 2018/19 being almost the same for both 2015-25 and 2018-28 LTPs, at $17.6 billion. Debt is forecast to increase 47% in the 2018-28 LTPs and expected to peak at $25.9 billion in 2026/27.
3.57
Metropolitan councils are forecasting the highest increase in debt during the 10-year period of the LTP, with debt increasing by 72%. The forecast lowest increase in borrowing, 28% for rural councils, is still significant. Auckland Council remains the largest council borrower.
Figure 9
Debt forecast in the 2015-25 and 2018-28 long-term plans
In the 2018-28 LTPs, debt is forecast to increase at a greater rate than was forecast in the 2015-25 LTPs and is expected to peak at $25.9 billion in 2026/27.
3.58
Not all councils are forecasting to have debt. In the current LTP forecasts, between six and eight councils forecast to have no external borrowings. The number increases as some councils forecast to repay their debt in the LTP period. Regional councils are more likely to not borrow.
3.59
By and large, the increase in forecast debt is to fund the councils' large capital expenditure programme, as discussed in paragraphs 3.23 to 3.33.
3.60
Some councils (Auckland Council, metropolitan councils, and other high-growth councils) generally have proportionately more debt than other councils. These high debt levels could limit how councils might respond to unexpected events.
3.61
Interest rates have been historically low in New Zealand since the global financial crisis. Based on the current LTP forecasts, councils overall are forecasting lower interest rates compared with 2015-25 (see Figure 10).
Figure 10
Interest expense and interest expense as a percentage of borrowing, as forecast in the 2015-25 and 2018-28 long-term plans
Councils overall are forecasting lower interest rates compared with 2015-25.
3.62
Councils that are borrowing need to have approaches to protect themselves from any significant increase in interest rates. Potentially small increases in interest rates above those forecast might mean that some councils are unable to service what they propose to borrow without making other changes, such as increasing rates or cutting expenditure.
10: Auckland Council prepared an LTP that covers the Council and its group of council-controlled organisations. Other councils prepared an LTP that included council-only financial forecasts. We included Auckland Council's group financial forecasts in our analysis.
11: Our financial analysis excludes Kaikōura District Council. An Order-in-Council in March 2018 allowed the Council to prepare a customised three-year plan in place of the standard 10-year LTP. There was no audit requirement for the three-year plan. The Government agreed to this approach because the Council faced exceptional circumstances after the Hurunui/Kaikōura earthquake. A similar approach was taken to support Christchurch City Council after the Canterbury earthquakes.
Our financial analysis also excludes Wairoa District Council and West Coast Regional Council, because their LTPs were not available when this report was written.
12: We have used the National Policy Statement on Urban Development Capacity 2016 to define high-growth councils. All other councils we have defined as low-growth.
13: In comparing to the 2015-25 LTP forecasts, we have not adjusted these forecasts for any LTP amendments adopted by councils.
14: The financial information compared in Figures 3 and 4, and in other parts of our report, was prepared at different times. This means the percentage movements discussed include the effect of inflation on councils since the 2015-25 LTPs were prepared.
15: By comparison, low-growth councils' forecast borrowing as a percentage of revenue does not exceed 120% during the period of the 2018-28 LTPs.
16: For more information, see Controller and Auditor-General (2018), Introducing our work about procurement, Wellington.
17: For example, the Government's KiwiBuild development scheme.
18: See, for example, Controller and Auditor-General (2018), Local government: Results of the 2016/17 audits, Wellington, pages 10 and 11.
19: See Controller and Auditor-General (2015), Matters arising from the 2015-25 local authority long-term plans, page 11.

