Appendix 7: Rural councils' forecast financial results
This Appendix provides a summary of rural councils' LTP financial forecasts.78 Rural councils have populations below 20,000. The data presented below is based on our own analysis and represents averages of data across councils in this sub-sector, unless otherwise stated.
In this Appendix, we have combined and presented financial information prepared by the rural councils. We do not have a view on the merits of these councils' financial forecasts, other than what we express in the main body of this report.
7.1
Operating revenue for rural councils, as forecast in the 2015-25 and 2018-28 long-term plans
In rural councils' 2018-28 LTPs, the operating revenue is 15% more than what was forecast for 2015-25.
| Revenue | 2015-25 LTP $billion |
2018-28 LTP $billion |
% increase |
|---|---|---|---|
| Rates revenue | 4.5 | 5.1 | 15 |
| Subsidies and grants revenue | 1.3 | 1.5 | 17 |
| Other revenue | 1.1 | 1.2 | 10 |
| Development and financial contributions | 0.0 | 0.1 | 123 |
| Vested assets (non-cash revenue) | 0.0 | 0.0 | 140 |
| Total | 6.9 | 7.9 | 15 |
Operating revenue movements compared with the 2015-25 LTP forecasts range from a 12% decrease for Chatham Islands Council to a 42% increase for Mackenzie District Council. Chatham Islands Council forecasts the least amount of rates revenue as a proportion of total revenue at 6% because it receives significant funding from the Crown to fund council operations. By comparison, five rural councils forecast more than 70% of their total revenue from rates revenue.
7.2
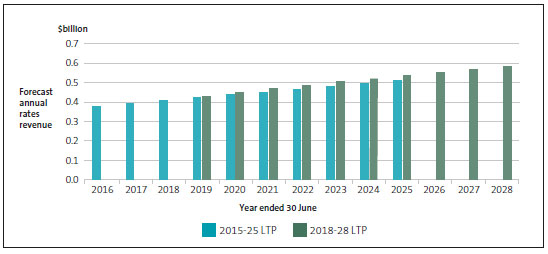
Rates revenue of rural councils, as forecast in the 2015-25 and 2018-28 long-term plans
Rural councils' rates revenue is forecast to increase 37% ($0.4 billion to $0.6 billion) across the 2018-28 LTPs.
7.3
Operating expenditure of rural councils, as forecast in the 2015-25 and 2018-28 long-term plans
Operating expenditure forecast in the rural councils' LTPs is 13% more than what was forecast for 2015-25.
| Operating expenditure | 2015-25 LTP $billion |
2018-28 LTP $billion |
% increase |
|---|---|---|---|
| Employee costs | 1.0 | 1.5 | 44 |
| Interest expense | 0.3 | 0.3 | 1 |
| Depreciation and amortisation | 1.8 | 2.0 | 12 |
| Other operating expenses | 3.4 | 3.6 | 6 |
| Total | 6.5 | 7.4 | 13 |
Operating expenditure movements compared with the 2015-25 LTP forecasts range from a 2% decrease for Chatham Islands Council to a 35% increase for South Waikato District Council.
7.4
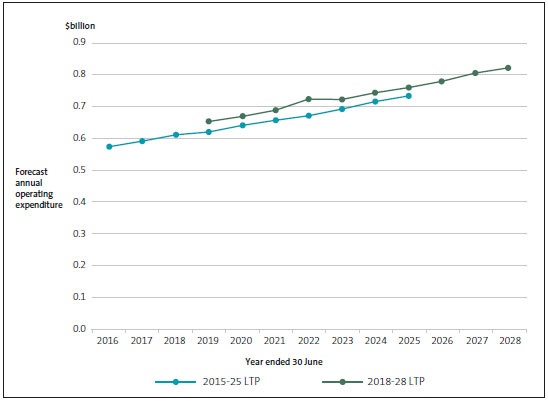
Total operating expenditure of rural councils by year, as forecast in the 2015-25 and 2018-28 long-term plans
There is a sharp increase in rural councils' forecast operating expenditure for 2021/22, which relates to Buller District Council forecasting the gifting of roading assets to the New Zealand Transport Agency.
7.5
Rural councils' forecast spending on capital in the 2015-25 and 2018-28 long-term plans
Capital expenditure for rural councils is forecast to increase by 25% for 2018-28 compared with the forecast for 2015-25, with most of the forecast capital expenditure being for renewing existing assets.
| Capital expenditure | 2015-25 LTP $billion |
2018-28 LTP $billion |
% increase |
|---|---|---|---|
| Meet additional demand | 0.1 | 0.2 | 114 |
| Improve the level of service | 0.5 | 0.6 | 26 |
| Renew existing assets | 1.5 | 1.8 | 19 |
| Total | 2.1 | 2.6 | 25 |
7.6
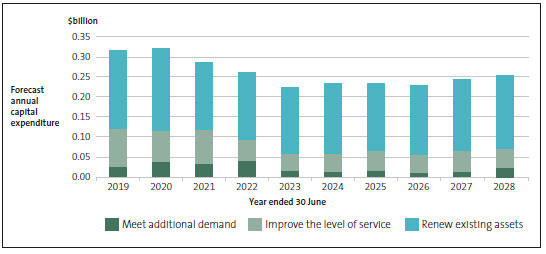
What rural councils plan to spend on capital by year, according to the 2018-28 long-term plans
More than 50% of the forecast capital expenditure for rural councils to improve levels of service and to meet additional demand is expected to be incurred from 2018/19 to 2021/22.
7.7
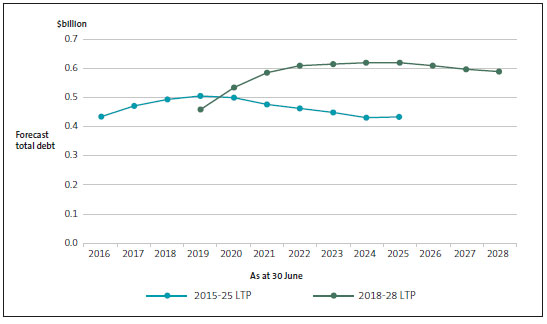
Total debt by year, as forecast in rural councils' 2015-25 and 2018-28 long-term plans
In the rural councils' 2018-28 LTPs, debt is forecast to increase from $0.5 billion to $0.6 billion from 2018/19 to 2027/28 (an increase of 28%), with most of the new borrowing planned for 2019/20 and 2020/21.
7.8
Total debt as a percentage of revenue, by year, as forecast in rural councils' 2015-25 and 2018-28 long-term plans
Other than for 2018/19 and 2019/20, rural councils' debt burden will be higher based on the 2018-28 forecasts, although it remains low compared with the sector as a whole.
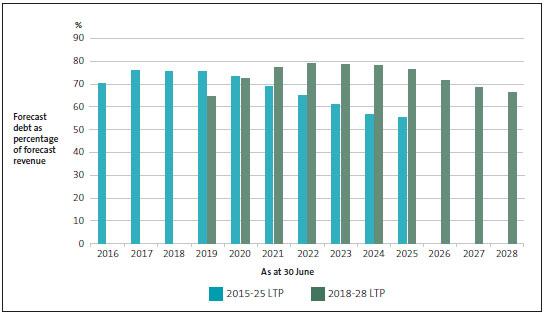
Rural councils are forecasting to require the least proportion of revenue to be able to service their debt of any sub-sector.
78: As noted in footnote 11, our analysis excludes Kaikōura District Council because it prepared a customised three-year plan instead of an LTP. Our analysis also excludes Wairoa District Council because its LTP was not available when this report was written.

