Part 2: Financial performance of district health boards
2.1
In this Part, we describe:
- the 2016/17 financial results for each DHB and the overall financial sustainability of DHBs;
- financial management practices of DHBs; and
- DHBs' spending on contracted services compared with spending on services they provide themselves.
District health boards' financial results
2.2
The second largest Vote in the Government's 2016/17 Budget was Health, with appropriations totalling $16.14 billion ($15.87 billion for 2015/16). In line with the 2016/17 Supplementary Estimates of Appropriations, $12.2 billion went directly to DHBs to provide health services. DHBs received about 4.2% additional funding in 2016/17 (the additional funding in 2015/16 represented a 2.8% increase).
2.3
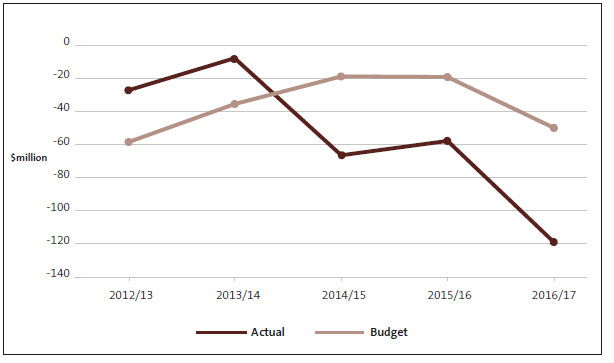
Figure 1 looks at DHBs' aggregate financial results and compares the actual deficit with what was budgeted. For 2012/13, we excluded insurance payouts of $294.7 million to Canterbury DHB, because this was a one-off event that would have skewed the overall result.
Figure 1
Comparison of district health boards' budgeted and actual deficit (aggregated), 2012/13 to 2016/17

2.4
DHBs' overall financial results have deteriorated since 2012/13, with the actual deficit significantly worse than budgeted in each the last three years. The overall deficit in 2015/16 was reduced by the $16.38 million deficit funding provided to Canterbury DHB in that year. No deficit funding was provided to Canterbury DHB in 2016/17.
2.5
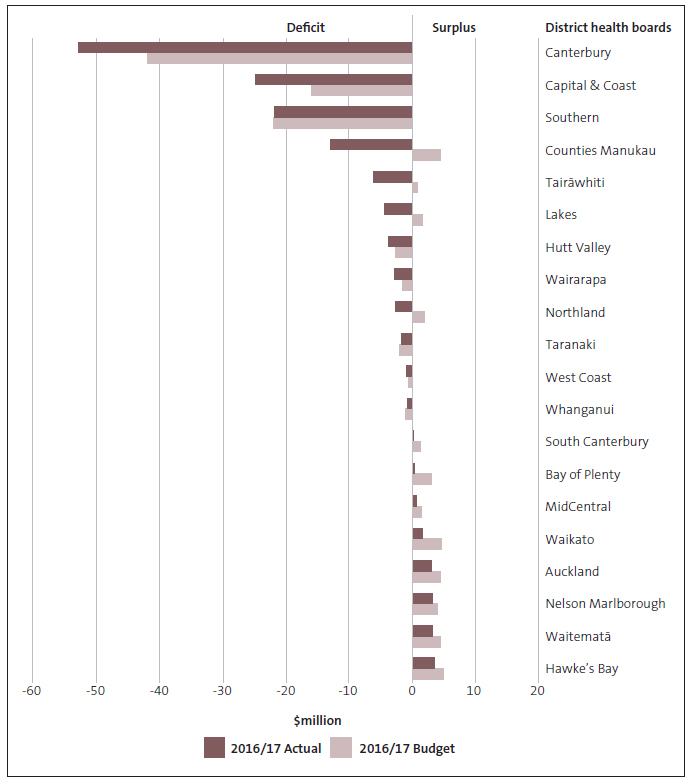
Figure 2 shows the actual and budgeted financial results for each DHB for 2016/17.
Figure 2
Financial results for district health boards, 2016/17
Note: There were errors in Figure 2 when we published this report. The corrected Figure is below and in the PDF.

2.6
DHBs with the largest deficits for 2016/17 were Canterbury, Southern, Capital and Coast, and Counties Manukau. Of these, only Southern DHB was within budget. Of the other 16 DHBs, 14 reported results that were worse than budget. Out of all 20 DHBs, 12 DHBs reported deficits in 2016/17. Canterbury DHB's deficit of $52.8 million was partly because of the increased costs, mainly capital charge and depreciation, from the new Burwood Hospital building.
2.7
Each year DHB boards must consider whether their DHB will have the resources to pay its expenses for the coming year. If this is in doubt the DHB might not be able to operate as a "going concern". In 2016/17, five boards concluded that they might not have the required resources for the coming year without further funding from the Government. These boards obtained letters of support from the Ministers of Health and Finance offering further funding if required.
Debt to equity conversion and the cost of capital
2.8
In 2016/17, the Government converted existing DHB debt to equity and ended DHBs' access to Crown debt funding of capital investment, meaning that DHBs can no longer use debt funding for large investments like new hospitals or expensive equipment. This was a significant change, achieved by providing $2.415 billion to DHBs through the Supplementary Estimates 2016/17. This has improved DHB balance sheets by reducing their liabilities and therefore increasing equity.
2.9
We understand that this change was the first phase in a review of the health capital funding system by the Ministry, in consultation with DHBs. The review is considering a new system to address the issue of affordability of capital investments. In our report Health sector: Results of the 2014/15 audits, we looked at the way that one part of the public sector capital funding system, the capital charge, worked in the health sector. We concluded that it was not clear what the capital charge regime is actually achieving in the health sector, and that it might be onerous for some DHBs, particularly those with static or declining populations. It is encouraging to see consideration being given to changes in capital funding for DHBs.
Financial management practices of district health boards
2.10
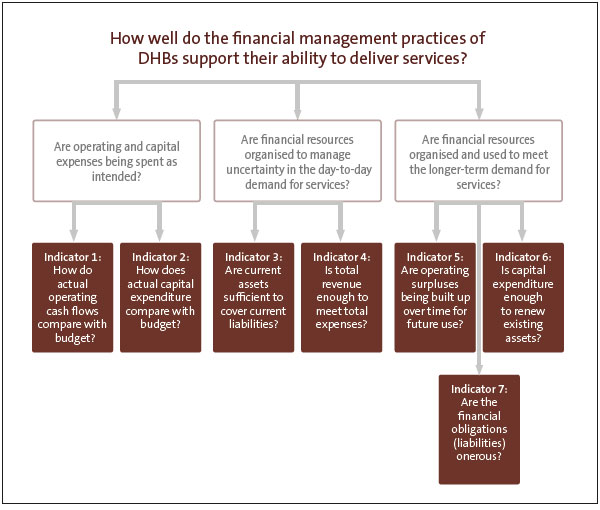
In our report Health sector: Results of the 2014/15 audits, we discussed how well the health sector's financial structure supported the delivery of health services. To do this, we examined several ratios, looking at data from the financial statements of all DHBs. The ratios we looked at (indicators), and the overall questions we wanted to answer by looking at these ratios, are outlined in Figure 3.
Figure 3
Questions and criteria for reviewing district health boards' financial management practices

2.11
For this report, we examined the same ratios for 2015/16 and 2016/17, looking for any significant movements. Rather than repeat our analysis of the full set of ratios, we have summarised our findings.
2.12
In general, there was little change from what we described in our 2014/15 report. Any movement there has been suggests further deterioration for some DHBs. The main points are:
- DHBs are still weak in accurately budgeting for and investing in capital. They tend to underspend on capital compared to their budgets and for the first time in many years, capital expenditure has fallen below depreciation. Depreciation is designed to reflect the progressive using up of the asset over its life. Taken together, this suggests DHBs may not be investing enough in maintaining or updating their assets.
- DHB's resilience and ability to invest for the future has deteriorated. DHBs have faced worsening deficits and declining cash flows in the last three years, which has resulted in a further deterioration in their ability to retain and use financial resources to deal with shocks such as pandemics or significant asset failure.
Providing services directly and contracting others to provide services
2.13
DHBs have two broad categories of spending. The first is to fund services provided directly by the DHB, mainly through hospitals and specialist services (the provider role). The second is to provide full or partial funding for third parties, such as general practitioners, to provide health services (the funder role). One of the challenges for DHBs is to find the right balance between the funder role and the provider role. This can be especially challenging when demand for provider services increases unexpectedly, as it did in some DHBs' emergency departments in 2016/17 or when DHBs are expected to provide expensive new hospital treatments when they become available.
2.14
Parts of the Health Strategy emphasise the importance of more and better care in the community, where effective prevention or management of conditions can reduce the need for expensive intervention in hospitals. We expect to see, over time, more spending allocated to the funder role relative to the provider role – for example, for primary health services.
2.15
In its February 2017 report, District Health Board Financial Performance to 2016 and 2017 Plans, the Treasury considered this tension between the funder and provider roles:
[It] raises the structural risk that DHBs prioritise funding for their own provider-arms (hospitals) at the expense of externally provided services (for example primary care). This risk may be particularly apparent when DHBs are under pressure to meet hospital output targets and avoid running deficits.
2.16
With many DHBs facing significant financial pressures, it is important to understand this risk. If DHBs' spending on primary health care is compromised, there could be higher and longer-term hospital costs as a result. Access to primary health services for those on low incomes might also be limited.
2.17
Although DHBs' spending on services from other providers had increased in recent years, the Treasury found that DHBs' spending has fallen slightly as a percentage of total expenditure. It also found that, as a percentage of total expenditure, DHBs spent less on these services than they planned to in 2014/15 and 2015/16.
2.18
We looked at DHBs' financial results for 2016/17 and saw that, again, DHBs tended to overspend on services that they provided directly and underspend on services provided by third parties. For all 20 DHBs, spending was $116.5 million more than planned on their own services and $61.3 million less than planned on services from other providers.
2.19
This shows that, in recent years, DHBs spent less than they originally planned on externally provided services. It is unclear whether these unspent resources were used to meet higher than anticipated demand for hospital services or to avoid or to reduce deficits in financially challenging circumstances.
2.20
We also do not know whether this affects the quality or scope of primary health care or health services. This situation also suggests that there could be barriers to successful implementation of the Health Strategy if spending is not happening where needed to advance some of the Health Strategy's objectives.
2.21
In our view, there would be benefit in more work by the Ministry, the Treasury, and DHBs to determine what is behind this pattern of spending by DHBs and whether it is affecting health outcomes.

