Part 3: Progress against our outcomes and strategic intentions
Achieving the outcomes we aim for
We assess that, in 2015/16, we mostly maintained or improved the outcomes that we seek to influence.
| Outcome: A trusted public sector | |
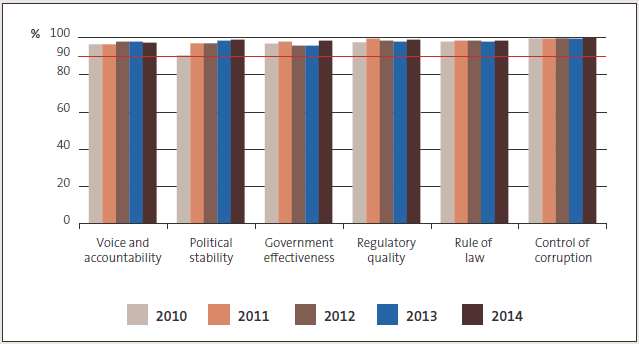
| Measure | New Zealand’s ranking in or above the 90th percentile of the Worldwide Governance Indicators is improved (or at least maintained).* |
| Result | Achieved when last assessed in 2014. |
| Comment | Results for the Worldwide Governance Indicators are usually published every September for the previous calendar year. The 2015 results are not yet available. |
| Figure 3 New Zealand’s ranking in the Worldwide Governance Indicators, 2010 to 2014  |
|
| Measure | The State Services Commission’s Kiwis Count Survey** shows improved (or at least maintained) rates of:
|
| Result | Achieved. |
| Comment | The Kiwis Count Survey measures New Zealanders’ trust in public services in two ways: by perception and by experience. Respondents rate their perception of trust in the public service and their trust based on their most recent public service experience. New Zealanders’ levels of trust in public services based on experience increased to 79% in 2015. This is a two-point increase from 2014 and a five-point increase since 2012. However, New Zealanders’ perception of trust has declined to 43%, two points lower than the 2014 result. Since 2012, perception of trust results have varied between 41% and 45%. |
| Measure | New Zealand’s score on the Transparency International Corruption Perceptions Index*** is improved (or at least maintained) |
| Result | Not achieved. |
| Comment | New Zealand’s world ranking has changed from second to fourth least corrupt country of the 168 surveyed. In 2015, New Zealand scored 8.8 out of 10 in the Transparency International Corruption Perceptions Index rankings. This was a decrease from 9.1 in 2014. From 2010 to 2014, New Zealand’s score has consistently been between 9.0 and 9.5. |
* See the World Bank website, http://info.worldbank.org/governance/wgi/.
** For survey results, contact the State Services Commission, www.ssc.govt.nz.
*** See the Transparency International website, http://www.transparency.org/cpi2015
| Outcome: A public sector that demonstrates responsible behaviour | |||||
| Measure | Public sector behaviour is more responsible in the area of accountability for public resources. | ||||
| Result | Achieved based on our assessment of results for the four indicators. | ||||
| Comment | Holding public entities accountable for their use of public resources is a fundamental part of our work. Indicators of responsible behaviour in the area of accountability for public resources include:
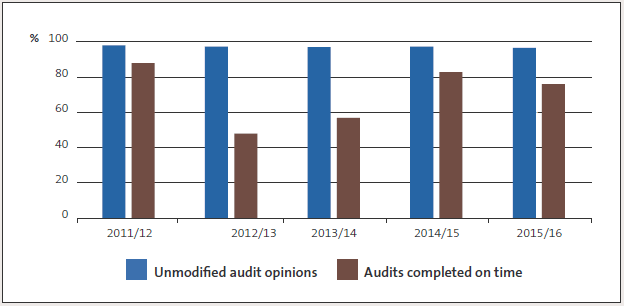
Figure 3 illustrates trends in the public sector for timeliness (as indicated by audits completed on time*) and reliability of information (as indicated by the issue of unmodified audit opinions). This year, 76% of public entities’ audit reports were signed within the statutory time frame, compared to 83% in 2014/15. Schools transitioning to new accounting standards and ongoing delayed production of year-end payroll reports contributed to the late completion of school audits and to the decline in 2015/16. However, overall timeliness has improved since 2012/13. We currently collect data about timeliness of public release only for local authority annual reports. For 2014/15, 96% of local authority annual reports were publicly available on time (92% for 2013/14). The percentage of unmodified opinions remains relatively steady. This year, 96.7% of audit opinions were unmodified, compared to 97.3% in 2014/15 and 97.1% in 2013/14. |
||||
| Figure 4 Percentage of unmodified audit opinions and audits completed on time, 2011/12 to 2015/16  Results for the central government sector (excluding schools) show an improving picture for management control environment (MCE), financial information systems and controls (FISC), and service performance information and associated systems and controls (SPIASC). Figure 5 Ratings for central government entities, 2011/12 to 2014/15 |
|||||
| 2011/12 | 2012/13 | 2013/14 | 2014/15 | ||
| MCE | |||||
| Very good | 56% | 62% | 59% | 62% | |
| Good | 39% | 32% | 34% | 32% | |
| Needs improvement | 5% | 6% | 7% | 6% | |
| FISC | |||||
| Very good | 47% | 52% | 48% | 53% | |
| Good | 47% | 45% | 43% | 42% | |
| Needs improvement | 6% | 3% | 9% | 5% | |
| SPIASC | |||||
| Very good | 4% | 8% | 9% | 8% | |
| Good | 66% | 74% | 73% | 79% | |
| Needs improvement | 30% | 18% | 18% | 13% | |
| In 2014/15, we reported information from the State Services Commission’s Integrity and Conduct Survey as indicators for our outcome: A public sector that demonstrates responsible behaviour. The three-yearly Integrity and Conduct Survey was scheduled to be held again in 2016. However, we understand that the State Services Commission has not committed to operating the survey in 2016. We therefore intend to explore new indicators for this outcome. |
|||||
* Audits completed on time is a proxy for the timeliness of public entities completing their financial and performance information within statutory time frames.
| Outcome: A high-performing public sector | |
| Measure The State Services Commission’s Kiwis Count Survey shows improved (or at least maintained) rates of service quality for all public services. | |
| Result | Achieved. |
| Comment | The overall service quality score for 2015 is 74, one point higher than for 2014 and two points higher than for 2013 and 2012. |
Progress against our strategic intentions
The Auditor-General’s strategic intentions 2014/15 to 2017/18 was developed to guide and focus our work from 2014/15 to 2017/18. The strategic intentions reflect the outcomes we seek and our intention to position our Office to influence future challenges and take advantage of opportunities presented.
Overall, we have made very good progress against our strategic intentions. We are strongly positioned to continue promoting transparency and accountability by public entities, and to play an important role in influencing and promoting lasting improvements in the performance of the public sector. Specific measures and performance targets for aspects of our strategic intentions are reflected in the measures for our outcomes.
We have enhanced the value of our core work by providing greater insight and value from our audits to help improve public sector performance. For example, our reflections reports, which bring together our insights and observations about our work, are now a product of our multi-year theme-based work programme. During 2015/16, we published our third reflections report, Reflections from our audits: Governance and accountability.
We have made good progress on our intention to lead by example as an organisation, and as individuals. Our staff engagement is on track, and we focus on continuously improving quality in all we do. Our project management and reporting disciplines are improving, but there is still work to do. For example, timeliness of completing the projects in our work programme has improved but is still well under target. Reviewing ourselves has provided further opportunities to improve.
Our work to connect more with citizens has seen us better equip our staff to act as Office “ambassadors” and seek the views of citizens about our work and to inform our work programme. We now regularly use social media channels to help our work reach more citizens.
Our work under the “Position our office for the future” strategic goal has seen us continue to contribute to and actively influence public auditing internationally and within New Zealand. We know our contribution to the international auditing community and to relevant legislative and administrative changes is valued. For example, we are chairing one of two Congress themes at the 2016 International Congress of Supreme Audit Institutions. We are also placing more focus on how to encourage and promote financial sustainability and integrated reporting in the public sector.
Strategic risks and risk management
The Auditor-General faces four ongoing strategic risks:
- loss of independence;
- audit failure;
- loss of capability; and
- loss of reputation.
We manage these risks mainly through processes that support the work we do. Details on how we manage these risks are available on our website. We will continue our focus on managing risks, particularly strategic risks. Our leadership teams regularly discuss risk management, including assessing environmental or internal changes that might affect the Office’s position. The Office’s Audit and Risk Committee usually meets four times a year and gives further insight and advice to help the Auditor-General to identify and manage risk. The Committee’s report for 2015/16, available on our website, outlines the Committee’s purpose and summarises its work during 2015/16.

