Part 5: Key performance indicators
5.1
In this Part, we describe EQC's progress against our 2013 recommendation about key performance indicators.
5.2
We recommended that EQC continue to refine key performance indicators for the programme to consistently and meaningfully cover cost, timeliness, quality, and safety, with targets where practicable.
5.3
The Appendix provides further information on what we found and recommended in 2013 about EQC's key performance indicators.
Summary
5.4
EQC has made improvements to its key performance indicators. The performance reporting is now more consistent and complete in terms of covering cost, timeliness, quality, and safety. This includes having targets for all the key performance indicators. However, many repairs still need to be fully completed.
Repairs still to be completed
5.5
The key performance indicators show that the rate of completion of repairs in the programme is slowing and behind target. Figure 8 shows the estimated number of repairs that have been practically completed and that are still to be practically completed as at 30 June 2015. There are three categories of repairs: primary substantive repairs, secondary repair work, and unanticipated additional repairs. 23
5.6 Figure 8 shows a higher number of repairs to complete than the information that has been available on EQC's website. The information in Figure 8 includes more detailed categories of repairs than has been available on EQC's website.
Improvements and continued activities
Improvements
5.7
EQC's Project Control Group has set new key performance indicators, and there have been improvements to the standing reports that are used to support Project Control Group meetings.
Figure 8 Estimated number of repairs completed and still to be completed, as at 30 June 2015
| Type of repair | |||||
|---|---|---|---|---|---|
| Primary substantive repairs completed and still to complete | Secondary repair work yet to complete | Unanticipated additional repairs | |||
| Volume of repairs | Practically completed | 66,252 | Not reported as at 30 June 2015, but estimated as 2694 as at 1 May 2015.** | 2923 still requiring further investigation. | |
| Started but not yet practically completed | 1018 | ||||
| Not yet started | 1767 | ||||
| Proportion of total repairs | Practically completed | 96.0%*** | 3.9% | 4.2% | |
| Started but not yet practically completed | 1.5%*** | ||||
| Not yet started | 2.6%*** | ||||
| Definitions | "Primary substantive repairs" are the main repair work whose elements are considered to be critical to a dwelling being usable for its intended purpose. Primary substantive repairs are considered to be practically completed when dwellings can be used for their intended purpose without material inconvenience, and the repairs are complete except for minor defects and minor omissions that are still to be completed. |
"Secondary repair work" is non-critical work anticipated at the time of the primary substantive repair that still needs to be completed. For example, external painting of houses, some drainage work, or repair to a garage that could not be accessed when repairs were made to the rest of the house. |
"Unanticipated additional repairs" is work that was not anticipated at the time of the primary substantive repair but may be required for several reasons. The reasons include damage missed in the scope of works for the original repair, additional damage from earthquakes, failure of repair materials or the repair solution, or workmanship below the required standard. Some records are not kept about some additional work performed by contractors at no additional cost, because of workmanship issues before primary substantive repairs are practically completed.* |
||
* EQR told us that, during the programme, contractors have been required to remedy poor workmanship at their own cost. However, the visibility of this work is low because it does not involve an additional or a new works order being issued and so is not recorded.
** This is our best estimate using the information made available to us from multiple EQC systems.
*** These percentages do not add up to 100 because of rounding.
5.8
Reporting now includes reports that show claims and flows relevant to the programme. 24 These reports include information on additional work and its cause.
5.9
EQR has adjusted its operational reports to reflect priorities as the transition to the end of the programme nears. This has involved a greater focus on outstanding repairs and the issues delaying repairs being completed.
5.10
The Project Control Group has recognised the importance of accurate claims numbers for budgeting and reporting. Getting certainty on the number of outstanding claims has been challenging.
Continued activities
5.11
Key risks continue to be regularly reported to the Project Control Group.
5.12
There continues to be extensive monthly reporting to the Project Control Group on health and safety issues. There is also a Health and Safety subcommittee of the EQC Board. EQR representatives attend this subcommittee's meetings.
The Earthquake Commission has improved its key performance indicators
EQC's reporting is now more consistent and complete in terms of covering cost, timeliness, quality, and safety. This includes having targets for all the key performance indicators. EQC has used these indicators to inform adjustments to the programme's configuration and to inform the variation to its project management services contract with Fletcher Construction.
5.13
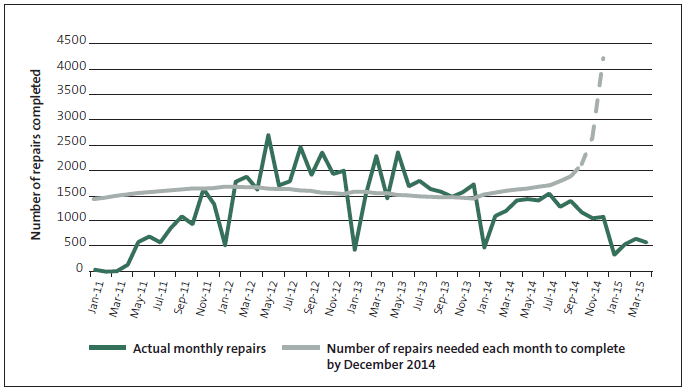
EQC and EQR have refined the key performance indicators that are regularly reported to the Project Control Group. Reporting against the key performance indicators shows that EQC has not met its planned repair rate and that the monthly number of repairs being completed in the programme is falling (see Figure 9).
5.14
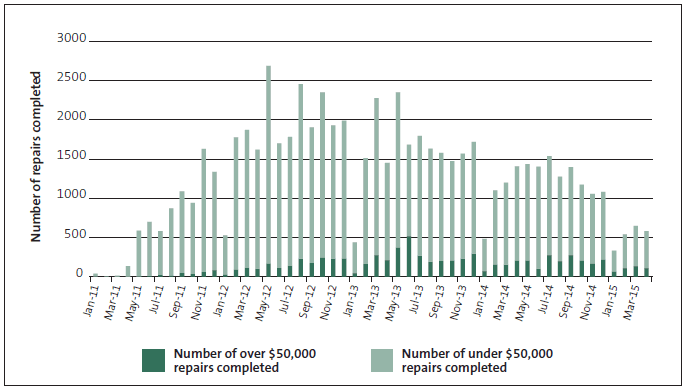
The rate of completion of repairs has been less than planned and less than was needed to meet EQC's targets. However, although the completed repairs more than $50,000 are trending down, they are increasing as a proportion of total repairs (see Figure 10). EQC told us that the falling repair rates was one of the reasons for including new performance measures in its project management service agreement with Fletcher Construction (the contract variation).
Figure 9
Number of repairs completed each month, January 2011 to April 2015

Note: The dotted portion of the grey line relates to the months after EQC's announcement that it was no longer aiming for the December 2014 end date.
Source: Graph based on information provided by EQC.
Figure 10
Number of primary substantive repairs completed each month by value, January 2011 to April 2015

Source: Graph based on information provided by EQC.
23: We acknowledge that some of the remaining repairs relate to people who do not want to have their homes repaired (EQC told us that this was about 600 people as at 1 October 2015), who are yet to make a decision about having their home repaired, or who are disputing a scope of works.
24: The "solar system" and "waterfall" reports show how many claims are at each part of the home-repair process (and other relevant areas such as complaints or unanticipated additional work) and the changes that have happened since our 2013 report.

