Part 3: Financial results and trends
3.1
In this Part, we summarise the financial results from the 2012/13 annual reports of local authorities, focusing on the audited information about operating revenue, rates revenue, operating expenditure, capital expenditure, and debt.
3.2
We also explore the financial trends in local authorities' annual reports using a set of indicators that we have developed. The indicators we use are outlined in Appendix 2.
3.3
The information excludes the results of Far North District Council and Hurunui District Council. The annual reports of those two local authorities were not publicly available when we prepared this Part (see paragraph 4.11).
What do the 2012/13 annual reports show?
Operating revenue and rates revenue
3.4
In 2012/13, local authorities recorded slightly less operating revenue ($8.14 billion) than in 2011/12 ($8.33 billion).
3.5
Local authorities levied rates of $4.53 billion, which was $36 million or 0.8% less than budgeted.
3.6
Local authorities have limited alternative revenue sources. In 2012/13, the other major sources of revenue were subsidies paid by the New Zealand Transport Agency, development contributions, and vested assets. Local authorities have limited ability to reduce their reliance on rates revenue.
Operating expenditure
3.7
In 2012/13, local authorities' total operating expenditure was $7.8 billion (down from $8.1 billion in 2011/12). Local authorities sought to contain their operating costs, and this helped them to constrain rates increases.
Capital expenditure
3.8
Local authorities' capital expenditure was $3.5 billion in 2012/13. This was $0.9 billion (20%) less than the $4.4 billion budgeted.3
3.9
Two local authorities accounted for $480 million of the $0.9 billion difference. Auckland Council spent $267 million less because some projects that were to be completed in 2013 will be completed in 2014 or later. Christchurch City Council had $213 million less capital spending because of delays rebuilding infrastructure and other capital projects.4
3.10
The accuracy of local authorities' forecasts of their capital expenditure was comparable to the prior year (see paragraph 3.27).
3.11
The 2012/13 results continue the significant trend of local authorities achieving substantially less capital work than budgeted. In our view, there is a need to analyse this in detail, particularly to identify whether there is a growing backlog of renewal work, whether budgeting is too optimistic for the local authority's contracting and administrative capacity, or whether some other factor is causing this shortfall.
3.12
We have collected and analysed the capital expenditure indicated in funding impact statements for 2012/13. Capital expenditure was disclosed in three categories:
- expenditure for new assets to meet additional demand;
- expenditure to improve service levels; and
- expenditure to replace or renew assets.
3.13
Local authorities spent less in dollar terms than budgeted. Their spending appeared to be more or less evenly spread between the three capital expenditure categories. Local authorities spent $245 million less on new assets to meet additional demand, $263 million less on assets to improve service levels, and $392 million less on renewals.
3.14
Although local authorities have invested in renewals up to the equivalent of 64% of depreciation, we are particularly concerned that local authorities are not spending their capital budgets for renewals (see paragraph 3.79). If assets are not being maintained because of a backlog of renewal work, then levels of service are likely to be affected over time, if not immediately.
Debt
3.15
Debt and capital expenditure variances are generally closely aligned because local authorities typically use debt to fund the construction of long-life assets (at least in part).
3.16
Local authorities had debt of $10.1 billion as at 30 June 2013. This was $45 million less than budgeted, but $1.6 billion (13%) more than as at 30 June 2012. The $45 million actual-to-budget variance is made up of those local authorities with $584 million more debt than forecast, and offset by those local authorities with $539 million less debt than budgeted.
Detailed analysis using our set of financial indicators
3.17
We completed a more detailed analysis of the financial information using our set of financial indicators. We did this to analyse the historical financial information data and assess the aggregate effect it has on aspects of financial uncertainty. We also comment on the local authorities that appear outside the calculated sector norms (the outliers).
Indicators of ability to operate as planned
3.18
We looked at the actual versus budgeted results from 2006/07 to 2012/13. A result of 100% indicates that actual results are in line with the plans the local authority has made.
Actual to budgeted cash applied to operations
 3.19
3.19
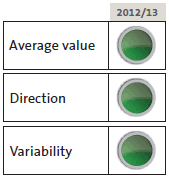
The cash applied to operations reflects a local authority's expenditure on operations.5
3.20
The average actual to budgeted cash applied to operations has improved slightly, moving from an average of 103% in 2011/12 to 101% in 2012/13. The average for the last seven years was 103%. This is in line with our expectations, given the long-term nature of many local authority assets and related services.
3.21
There is moderate variability in how accurately local authorities set their budgets for operations. During the last three years, 38% of local authorities were outliers (that is, outside the calculated sector norms).
3.22
Overall, local authorities are becoming increasingly accurate in this aspect of budgeting. Compared with 2011/12, 27 local authorities had results that were further from the sector average but 40 had results that were closer to the average. Nine showed no change from the position of their results in 2011/12.
3.23
We saw three notable outliers. Bay of Plenty Regional Council achieved 86% of the operational cash flow budgeted. This is below the 94% achieved in 2011/12 but consistent with its seven-year trend. Operational cash flow has been below budget in each of the last five years − in the range of 85% to 94%. The Council budgeted to receive revenue from central government and the Infrastructure fund to restore Rotorua Lakes,6 but this did not occur.
3.24
Whakatane District Council also achieved 86% of the operational cash flow budgeted. This was below the 99% achieved in 2011/12. For this local authority, we noted fluctuations ranging from 86% to 146% in the last seven years, with an average of 115%. The fluctuations appear largely related to emergency works that were required after floods in some years. In 2012/13, user fees and charges for waste, building inspections, resource consents, and trade waste were all less than budgeted.
3.25
Mackenzie District Council had significantly higher operational cash flows than budgeted, with a result of 140% against budget. This is substantially higher than its average for the last six years of 102% and higher than the results for the last two years, which were 90% and 95% respectively. The Council received more revenue from regulatory and consent fees and lease income in 2012/13 than budgeted.
3.26
It appears that the most significant challenge is budgeting for revenue that is not within the control of the local authority. By its nature, this type of revenue can be difficult to forecast. We consider that local authorities are, on average, managing operational cash flows accurately. However, at a more detailed level, there are often more significant inaccuracies in the actual to budgeted results. We encourage local authorities to focus on budget accuracy at a project level, where possible.
Actual to budgeted capital expenditure
 3.27
3.27
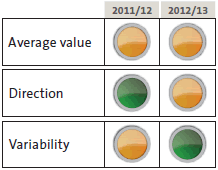
In 2012/13, local authorities spent, on average, 78% of budgeted capital expenditure. This compares to an average of 79% for 2010/11, 2011/12, and 2012/13. There was low to moderate variability in the accuracy of the actual to budgeted capital expenditure. During the three years, 38% of the local authorities were outliers.
3.28
As well as the notable outliers discussed below, 14 local authorities spent less than 60% of budgeted capital expenditure and three local authorities spent more than 120% of budgeted capital expenditure.
3.29
Kaikoura District Council spent only 41% of its budget for capital expenditure. This was because construction of the new combined museum, library, and Council office facility was delayed. The lower spending was offset by a small unbudgeted project to build three new pump stations (funded by reprioritising another project that was delayed the year before). In other words, Kaikoura District Council's modest capital spending was significantly affected by a large capital project that did not start as planned.
3.30
Auckland Council spent only 45% of budgeted capital expenditure, because a wide range of projects were revised and refined during the year. Examples include renewals work on the Council's administrative buildings that did not take place after the decision to buy a new building, and waterfront developments that were delayed while decisions about upgrades were finalised. Delays in getting approvals from Local Boards delayed some local projects. The Council is seeking to set more accurate budgets for capital expenditure.
3.31
West Coast Regional Council had significantly more capital expenditure than budgeted (spending was 156% of the budget). This was because of the unbudgeted purchase of land and construction of a building. Again, this shows how having one or two proportionally large projects affects a small local authority. In our view, this trend of spending less capital work than budgeted is of concern, particularly if it affects the level of service that communities expect to receive.
Actual-to-budgeted debt
 3.32
3.32
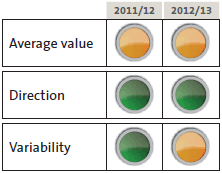
The accuracy with which local authorities forecast their debt requirements remained steady at 88%, in line with the result achieved in 2011/12. This is highly aligned to the actual-to-budgeted capital expenditure result. The average actual-to-budgeted debt for 2010/11, 2011/12, and 2012/13 was 86%.
3.33
There was moderate variability in how accurately debt was budgeted. Few local authorities budget for debt needs accurately. During the three years, 31% of the results were outliers. This result is closely in line with the actual-to-budgeted capital expenditure (see paragraphs 3.27-3.28), which is to be expected.
3.34
Eight local authorities had no debt as at 30 June 2013. Another six local authorities had debt balances less than $1 million. Five of these 14 local authorities were regional councils.
3.35
Marlborough and Westland District Councils were the only outliers, with debt balances greater than $10 million. These debt balances had a large effect on the average result. Marlborough District Council budgeted for $51 million of debt but finished the year with only $22.5 million. The reduced debt was because of delays in the forecast capital spending on water, wastewater, and solid waste projects. Some delays in buying properties delayed the roading capital programme, which, in turn, reduced the debt requirement.
3.36
In contrast, Westland District Council budgeted for $12 million debt and closed the year with a balance of $15.5 million. During 2012/13, some significant budget inaccuracies were identified, including the debt forecast.
3.37
We also noted several smaller local authorities that budgeted for debt below $10 million and did not borrow in line with their budget. These local authorities were Carterton District Council, Chatham Islands Council, Kaikoura District Council, Opotiki District Council, Rangitikei District Council, Stratford District Council, and Waimate District Council. West Coast Regional Council was the only local authority with a difference between budget and actual that was beyond one standard deviation from the norm. Although outside the norm, the amount involved was not large – West Coast Regional Council incurred less than $4 million debt. There is an ongoing aversion to using debt among smaller local authorities.
3.38
Figure 4 shows the spread of local authorities' debt balances as at 30 June 2013, and the percentage difference between their debt balances and their forecast debt.
Figure 4
Local authorities' debt as at 30 June 2013 and the percentage differences between forecast and actual debt
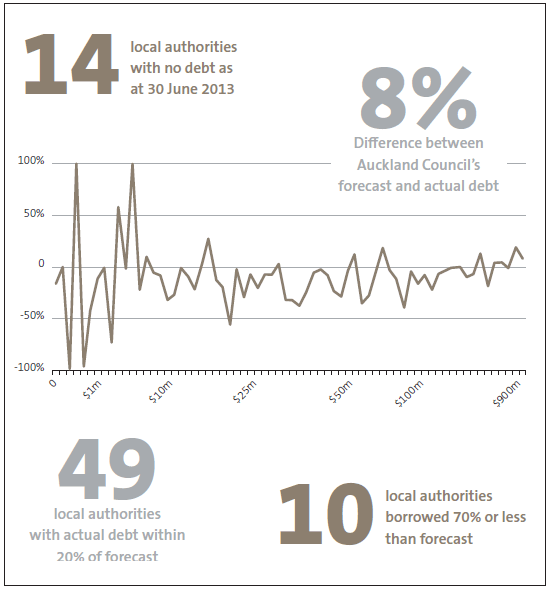
Note: Auckland Council is not included in the line graph because it operates on a much larger scale than other local authorities. Auckland Council's debt as at 30 June 2013 was $4.7 billion. It was 8% higher than forecast.
Summary observations about local authorities' ability to operate as planned
3.39
Overall, the average positions for local authorities against our indicators of ability to operate as planned have remained stable. The ability to budget for operational expenditure is sound at a high level, although there are more significant variances within categories of expenditure. The ability to forecast capital expenditure accurately has deteriorated slightly.
3.40
In our view, local authorities need to improve their forecasting for capital expenditure – results are consistently below the amounts forecast. The ability to forecast debt requirements accurately has slightly improved, but most local authorities are persistently over-estimating their debt requirements. This is highly aligned to under-delivery against capital expenditure budgets.
Local authorities' ability to manage uncertainty
3.41
We looked at three indicators that consider local authorities' ability to respond to short-term shocks.
Working capital
 3.42
3.42
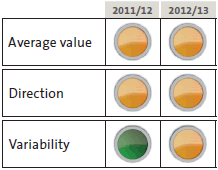
The working capital indicator compares current assets to current liabilities. It measures whether a local authority has enough resources to pay its debts when they fall due without having to borrow further or sell long-term investments and assets.
3.43
A result of 100% indicates a match between current assets and current liabilities. A result greater than 100% is preferable because it indicates that there are more resources available to respond to short-term unexpected events.
3.44
The average working capital ratio in 2012/13 was 161%. This was slightly higher than in 2011/12 and 2010/11. During the last three years, 26% of local authorities were outliers.
3.45
In general, regional councils have higher working capital percentages than territorial local authorities. For example, in 2012/13, the highest regional council result was 735%. This is because territorial local authorities typically have some debt reflected in current liabilities.
3.46
Debt is classified as a current liability if it is due for repayment in the next 12 months. Local authorities typically have arrangements where this debt is reissued under different borrowing terms and conditions. This can have a significant effect on this indicator. However, it might not reflect an immediate need for funding.
3.47
Bay of Plenty Regional Council, Central Otago District Council, Clutha District Council, Environment Southland, Hawke's Bay Regional Council, Kawerau District Council, Mackenzie District Council, Napier City Council, Otago Regional Council, and Wairoa District Council have been consistent outliers for the last seven years. Each has had working capital ratios greater than 200% each year.
3.48
The highest ratio in this period was for Wairoa District Council, with a working capital ratio of 1760% in 2006/07. On the other hand, 36 local authorities (47%) had working capital ratios of less than 100% for 2012/13.
3.49
Our analysis looked at working capital at a point in time. We acknowledge that some local authorities manage their working capital and cash requirements closely during the year to reflect when cash is required. For example, it is more cost-effective to draw on cash facilities when required because investment returns are always less than the cost of borrowing.
3.50
We also note that a very high working capital ratio does not always reflect good working capital management. A high working capital ratio could mean that a local authority is not managing its cash resources effectively by, for example, paying off debt rather than holding cash as an investment.
3.51
Compared to other local authorities, the 36 local authorities with a working capital ratio of less than 100% had less ability to manage uncertainty. We acknowledge that significant debt could be included in current liabilities that could be reissued subject to different credit terms and conditions.
Enduring operating expenses to total operating expenses
 3.52
3.52
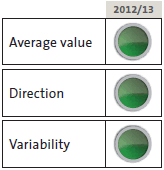
The enduring operating expenses to total operating expenses indicator compares the level of fixed costs as a proportion of total operating expenses.7 In calculating this, we have defined employee benefits, interest, depreciation, and amortisation as enduring or fixed operating expenses. The greater the percentage, the less flexibility the local authority has to change its operations.
3.53
The average enduring operating expenses to total operating expenses result for 2012/13 was 49%. This is a slight increase from the 2011/12 result of 47%, and reflects a trend that has seen the average result steadily increase from 45% in 2006/07.
3.54
Variability throughout the sector is low. Although 37% of local authorities were outliers during the last three years, their results were tightly clustered around the sector average.
3.55
Overall, we did not identify any concerning trends for this indicator.
Interest expense to rates revenue
 3.56
3.56
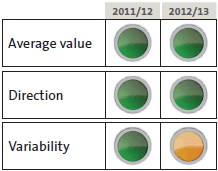
The comparison of interest expense to rates revenue looks at the proportion of rates revenue used to service debt.8 A high percentage means less flexibility and fewer resources available to respond to unexpected events.
3.57
The average interest expense to rates revenue has decreased from last year to 7.3%. In Matters arising from the 2012-22 local authority long-term plans (our long-term plan report),9 we reported that the average in the long-term plans was 9%.
3.58
Although there was moderate to high variability, the result is affected by some local authorities that did not incur any interest expense because they had no debt. Thirty-four percent of the results in the last three years were outliers. The 2012/13 result shows a decrease in the average and a small change in the number of outliers.
3.59
International practice suggests that interest costs to revenue can become challenging for a public entity to manage when they exceed 10%. However, we note that our comparison is to rates revenue, which is only part of a local authority's revenue stream. Overall, the local authorities had moved slightly away from this level in 2012/13.
3.60
Nineteen local authorities spent a higher proportion of rates revenue on financing costs in 2012/13 than in 2011/12. On the other hand, 28 local authorities spent less of their rates revenue on financing costs in 2012/13 than the previous year. This indicates that there is significant variability among local authorities.
3.61
As we noted last year, some local authorities had high debt balances and used a high proportion of rates revenue to cover the interest expense. Compared to other local authorities, these local authorities had an increased risk of not being able to respond to short-term events.
3.62
We saw three notable outliers. Tauranga City Council had interest expense to rates revenue of 25%. This was one percentage point lower than in both 2010/11 and 2011/12. The Council's debt had stabilised in 2012/13 after substantial increases in each of the previous three years. The Council had reduced the level of capital work carried out because of the slowed rate of population and economic growth. This resulted in a steadying of this indicator.
3.63
Taupo District Council had interest expense to rates revenue of 20% in 2012/13. This was consistent with its position for the last two years. The Council's debt had also stabilised after several years of significant increases. Although the Council had significant infrastructure expenditure in recent years, it had sold surplus land and used the proceeds from forestry harvesting to manage the growth in debt. The Council signalled this approach in the financial strategy in its 2012-22 long-term plan.
3.64
Auckland Council also had interest expense to rates revenue of 20% in 2012/13. This was an increase from 16% in the previous year. This reflected the Council's growing debt balance to service a wide range of capital projects. Based on gross interest expense, this indicator was forecast to increase to 29% in the next three years. However, Auckland Council holds about $300 million of cash reserves and borrows on behalf of Watercare Services Limited (which sets water charges to pay for expenses, including interest expense – these charges are reflected in Auckland Council's group revenue).
Summary observations about local authorities' ability to manage uncertainty
3.65
Local authorities were generally in a reasonable position to manage uncertainties when they arose. The average results for these indicators did not indicate any significant changes in 2012/13 from prior years.
3.66
Although there was little variability in results for enduring expenses to total operating expenses, there was wider variability between local authorities for interest expenses to rates revenue and working capital indicators. This indicates the importance for each local authority to carefully monitor these indicators, particularly if the local authority had a result significantly different from the average. This could signal a reduced ability to respond to unexpected events.
Ability to invest for the future
3.67
We looked at three indicators that consider how durable a local authority is with longer-term uncertainties and in maintaining itself indefinitely by investing for the future.
Capital expenditure to depreciation
 3.68
3.68
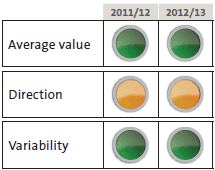
The capital expenditure to depreciation indicator reflects the reinvestment needed to maintain or improve the assets' performance capability and the nature of the service that the assets provide. We also analysed renewals expenditure to depreciation, because this provides a better picture of assets' ability to sustain services.
3.69
We were unable to look at renewals to depreciation last year because local authorities were not required to disclose the level of renewals in annual reports – now they are. The Transparency, Accountability and Financial Management amendments to the Act made disclosure of renewals, including comparative data from the previous year, compulsory from 2012/13 onwards.
3.70
The average capital expenditure to depreciation for 2012/13 was 154%. There was low to moderate variability between local authorities. Thirty-six percent of results were outliers.
3.71
We saw no clear trend because the average percentage for all local authorities continued to fluctuate.
3.72
In our long-term plan report, we reported that the average forecast was 135% for the 10 years to 2021/22. However, we noted that there was a downward movement, with the capital expenditure forecast to be 207% in 2012/13 and 111% in 2021/22. The actual capital expenditure during 2012/13 was considerably less than that forecast.
3.73
For 16 local authorities, capital expenditure was less than 100% of depreciation. The capital expenditure of these local authorities ranged from only 58% to 98% of depreciation. In contrast, Christchurch City Council had capital expenditure of 551% of depreciation because of the substantial earthquake recovery work. Otago Regional Council had 488% expenditure to depreciation because of significant flood protection work on the Leith river.
3.74
Northland Regional Council, which had capital expenditure of 441%, had also been investing significantly in flood protection work, and significant non-depreciable assets affected the results.
3.75
Local authorities with fast-growing communities typically had a higher proportion of capital expenditure to depreciation. However, we noted a reduction in the 2012/13 spending on capital by Auckland Council, Tauranga City Council, and Tasman District Council. In contrast, Kapiti Coast District Council and Selwyn District Council both had capital expenditure of more than 300% of depreciation.
3.76
The capital expenditure should reflect information set out in the asset management plans. As discussed in paragraphs 3.27-3.31, local authorities tended to carry out fewer capital works than budgeted.
3.77
Three local authorities consistently had capital expenditure to depreciation of less than 100%:
- Hutt City Council ranged from 71% to 90% from 2007/08 to 2012/13;
- Waimate District Council ranged from 63% to 98% from 2006/07 to 2012/13; and
- Kawerau District Council continued to show the least capital investment, with a range of 44% to 72% in the last seven years.
3.78
A consistently low percentage could call into question the local authority's ability to maintain assets in the long term. Kawerau District Council put its low reinvestment down to the relative newness of the town. However, the Council needs to carefully consider whether capital expenditure is enough to maintain desired levels of service in the long term and whether the relative age of the town remains a valid argument. Capital expenditure that is too low, even if it is in line with long-term plan forecasts, could lead to a sizeable need for renewal-related capital expenditure beyond the period of the long-term plan forecasts.
3.79
The average renewal expenditure to depreciation for 2012/13 was 64%. This was an increase on 2011/12, where the result was 60%. However, 28% of results were outliers during the two years, including 6% that were outside two standard deviations from the average.
3.80
In our long-term plan report, we reported that the average forecast was 75% during the 10 years to 2021/22. However, we noted that there was a downward trend, with the renewals forecast to be 92% in 2012/13, falling to 73% in 2021/22. Therefore, the renewals spending during 2012/13 was considerably below that forecast.
3.81
We could not identify any characteristics common to the five local authorities that had renewals spending to depreciation scores of less than 40%. Of the three local authorities with the lowest overall capital expenditure results, two had renewals results below the average for the local authorities and one was above the average. However, none of the three was one of the five local authorities with the lowest renewals spending.
3.82
Renewals are fundamental to the sustainability of a local authority. There is no definitive standard for the appropriate level of renewal. We consider it is reasonable to expect each local authority to have a different profile. However, many communities in New Zealand were established in the 1950s, and we expect renewal work on assets to be essential now to maintain levels of service.
3.83
We are concerned that, in the interests of holding down rates increases or because of the lack of available capacity to complete the work, renewal work has been deferred. It cannot be deferred too long. A more in-depth analysis of this matter is required.
Gross debt to total assets
 3.84
3.84
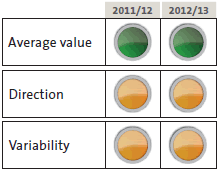
For the gross debt to total assets indicator, a value of more than 100% indicates that a local authority has more debt than assets. This is highly unlikely in any organisation. For public entities, we expect the debt to assets indicator to be well below 50%.
3.85
For 2012/13, the average gross debt to total assets for local authorities was 5%. This was a slight increase on the average of 4.7% for 2011/12. There was moderate to high variability in this indicator, with 44% of local authorities being outliers for 2010/11, 2011/12, and 2012/13.
3.86
Most local authorities maintained a result similar to previous years, while others showed small increases. In our long-term plan report, we stated that the average gross debt to total assets forecast in the 10 years to 2022 was 6%. This means that the average for 2012/13 was comparable to that forecast for the coming years.
3.87
It is important to note that local authority assets, particularly infrastructure, are seldom sold. Therefore, they are not really available to repay debt. The important matter for local authorities is the ability to service and repay debt from operating revenue sources.
3.88
Seven local authorities − Central Otago District Council, Environment Southland, Mackenzie District Council, Northland Regional Council, Taranaki Regional Council, Waikato Regional Council, and Wairoa District Council − had no debt in any of the five financial years from 2008/09 to 2012/13.
Net cash flows from operations to capital expenditure
 3.89
3.89
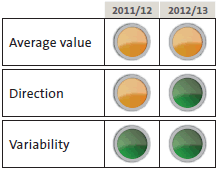
The comparison of net cash flows from operations to capital expenditure looks at the local authority's cash surplus (or deficit) from normal business-as-usual operations that has been or could be used towards capital expenditure requirements.
3.90
Apart from the cash surplus from normal operations, a local authority can fund capital expenditure by selling investments or assets, or by borrowing to fund the long-life assets.
3.91
A higher percentage indicates that the local authority is funding capital expenditure with internally generated funds rather than external funding (debt).
3.92
In 2010/11, 2011/12, and 2012/13, the average net cash flow from operations to capital expenditure was 82%. The average percentage in each of the three years was between 78% and 87%. For the three years, 40% of the local authorities were outliers.
3.93
No local authorities were consistently outliers. An average of about 80% is not a result that gives us cause for concern. If the percentage decreased over time, it would mean that local authorities were relying more on external funding.
Summary observations about local authorities' ability to invest for the future
3.94
We have not identified any significant movements in the indicators for 2012/13 compared to previous years. However, we are concerned by the extent of variability that we identified and caution local authorities to monitor their individual positions against these important long-term measures.
3.95
We particularly note that actual capital and renewals expenditure is below that forecast in the 2012-22 long-term plans. Local authorities need to clearly understand the implications of their asset renewal choices on their ability to deliver services to the community.
3: This information has been extracted from funding impact statements of local authorities. Because Auckland Council prepares a group funding impact statement, the figures include the capital expenditure of Auckland Council's subsidiaries.
4: Many of the capital projects are part of the infrastructure rebuild programme funded by insurance recoveries and Crown contributions. The wastewater activity has the largest share of infrastructure rebuild spending (see Christchurch City Council (2013), Christchurch City Council Annual Report 2013, page 133).
5: Note that in Local government: Results of the 2011/12 audits, we used net cash flows from operations for this indicator. We now consider that cash applied to operations is a better measure of stability than the net operating cash flow.
6: A sum of $6.8 million was budgeted to be received from the Ministry for the Environment – the Rotorua Lakes deed funding. If this had been received, it would have been disbursed to Rotorua District Council.
7: We did not use this indicator in previous years.
8: We have used uncapped data for this comparison because we consider that the sensitivity of this indicator means that the overall position on an uncapped basis is most relevant.
9: Controller and Auditor-General (2012), Matters arising from the 2012-22 local authority long-term plans, page 62.

