Part 5: Analysing transport-related information in our audits of local authorities' 2012-22 long-term plans
5.1
The requirements of the LGA and the Land Transport Management Act 2003 mean that local authorities were required to prepare their 10-year long-term plans ending in 2021/22 before NZTA released its NLTP for 2012-15. Collectively, local authorities expect to receive $6.5 billion in subsidies and grants during the next 10 years. Because of the different timing of the LTP and NLTP cycles, there are likely to be changes required in local authorities' planned transport expenditure and services.
5.2
Using asset management plans to work out capital and operating expenditure, local authorities expect to spend $11.7 billion during the 10 years to 2021/22 on capital expenditure related to transport, with the largest proportion ($6.5 billion) on replacing assets.
5.3
Local authorities face many challenges planning their transport activities – these challenges include how best to replace ageing infrastructure, responding to changing land use, and managing higher input costs.
5.4
There is evidence that local authorities are well placed for long-term sustainability of transport assets because of forecast investment and reinvestment. However, the spending forecast relies on good asset management planning.
Legislative background
5.5
Local authorities were required to prepare and have audited a 10-year plan covering 2012/13 to 2021/22. We discussed the results of the long-term plans in our December 2012 report Matters arising from the 2012-22 local authority long-term plans.
5.6
The LGA requires local authorities to separately disclose how they will provide for roads and footpaths in their long-term plan.29
5.7
All territorial and unitary local authorities are responsible for managing local roads.30 Regional councils provide public transport services.
5.8
For each group of activities, local authorities were required to disclose:
- the rationale for delivery, including the community outcomes to which the group of activities primarily contributes;
- any significant effects that any activity may have on the social, economic, environmental, or cultural well-being of the local community;
- information in detail for the first three years and an outline for each of the subsequent years of the long-term plan;
- the capital budgeted to:
- meet additional demand;
- improve service; and
- replace assets.
- the intended service, the performance measures, and performance targets;
- any intended changes in service before the first year of the long-term plan and the reasons for those changes;
- the reason for any material change to the cost of the service; and
- a funding impact statement that sets out funding expected from all sources and how the funds are to be used.
5.9
Local authorities set performance measures and targets for activities and report achievements against these in their annual reports. From 2014/15, local authorities must use a standard set of performance measures when reporting on the delivery of five groups of activities (see paragraph 4.24). CCOs that provide a group of activities will also have to use the same performance measures.
Transport funding in the 2012-22 long-term plans
5.10
Our financial analysis in this report covers 77 local authorities because Christchurch City Council did not prepare and adopt a 2012-22 long-term plan (legislation gave Christchurch City Council that option).
5.11
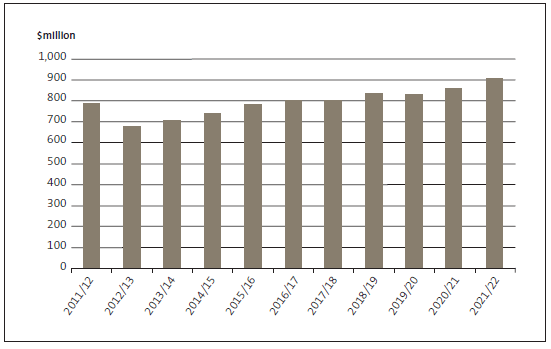
Local authorities have forecast that they will receive $6.5 billion in subsidies and grants (for operational and capital purposes), largely from NZTA, to fund local roads during the 10 years. Figure 6 shows subsidies and grants revenue increases during the 10 years. The drop from 2011/12 to 2012/13 is because Greater Wellington Regional Council received $96 million of central government funding for trains in 2011/12.31
Figure 6
Forecast transport subsidies and grants in the 2012-22 long-term plans

5.12
As NZTA developed the 2012-15 NLTP, it sent signals to local authorities about likely funding levels. Because these funding levels were not confirmed until after local authorities had adopted their 2012-22 long-term plans, local authorities made assumptions about the level of NLTF funding they expected to receive. Most local authorities assumed that NZTA subsidies would not change. Some local authorities said that funding for the first three years of the long-term plan would be constant or that there would be no increase in NZTA funding. This means that the funding amount in real terms is less.
5.13
NZTA announced the NLTP for 2012/13 to 2014/15 after local authorities adopted their long-term plans, so the funding forecasts in the long-term plans are likely to be different to what local authorities will realistically receive from NZTA.
5.14
This likely change in funding will affect local authorities' planned transport capital expenditure and services. Many local authorities said that, if funding is reduced, they may need to increase rates, adopt alternative funding sources such as fees and charges, cut projects that NZTA does not fund, or reduce services. Not carrying out renewals or improvements to services may lead to an increase in road roughness, the number of potholes, cycleway faults, and trip hazards on footpaths.
5.15
To work out what, when, and how many transport projects are required, local authorities need good asset management plans. Asset management plans are important for working out the NZTA subsidies that local authorities will apply for and whether work meets funding criteria.
Capital expenditure and asset management plans
5.16
Asset management plans inform expenditure forecasts. An asset management plan is a plan for managing a local authority's infrastructure and other assets to deliver an agreed service.
5.17
Each local authority's road and transport needs are different because each local authority area has different infrastructure and service needs. Rural local authorities typically have relatively large roading networks. For example, Southland District Council looks after 4981 kilometres of roads, but Wellington City Council looks after only 684 kilometres of roads. Auckland has greater public transport needs than those of the sparsely populated West Coast of the South Island.
5.18
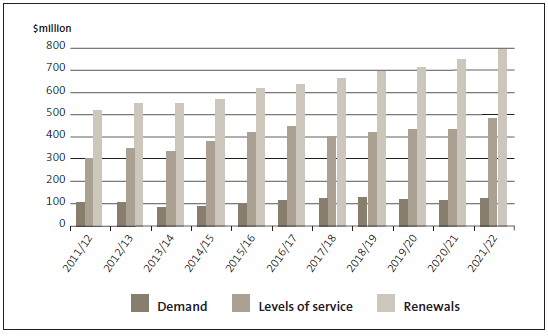
Local authorities work out the priorities and the investment that their communities require. They saw affordability and sustainability as the main drivers in preparing their 2012-22 long-term plans. In the 10 years to 2021/22, local authorities plan to incur $11.7 billion in capital expenditure on transport projects. This amount is split into:
- $6.5 billion (57%) to replace assets (renewals);
- $4.1 billion (34%) for improvements to services; and
- $1.1 billion (9%) to meet additional demand.
5.19
Figure 7 shows forecast capital expenditure in the 10 years from 2012/13 to 2021/22 and estimate actual expenditure for 2011/12. The expenditure for additional demand usually results from growth. Local authorities may collect growth charges such as development contributions or financial contributions for network infrastructure because of additional assets or assets of increased capacity.
Figure 7
Forecast transport capital expenditure in the 2012-22 long-term plans

5.20
We expect expenditure on meeting additional demand to be small compared to expenditure on services and renewals.
5.21
An asset's quality and condition has a significant bearing on how best to manage it. For example, Southland District Council's long-term plan stated that Southland has an ageing network of sealed roads. Many of the roads were built during the 1960s and 1970s, so are nearing the end of their lives, including a significant proportion just outside the 10-year long-term plan time frame. Therefore, Southland District Council requires significant investment to maintain the same service. If the NZTA subsidy is less than expected, then Southland District Council will need to change services or reduce asset configuration, such as by extending the life of roads.
5.22
Some rural local authorities' long-term plans consider how land use in their district is changing. Stratford District's roads have low traffic volumes. However, harvesting of forestry will lead to significant volumes of heavy loads using roads not designed to take heavy loads. As a result, Stratford District Council has had or will need to upgrade these roads to handle the increased loading. This will affect the road roughness/smoothness standard that Stratford District Council is striving for.
5.23
With the move to dairy farming, Gore District is experiencing intensified land use, which may further stress roads. Large lignite projects, such as a planned lignite urea plant,32 repeatedly stress parts of Gore District's network. As part of the Gore District Growth Strategy, Gore District Council has prepared models to assess the effect of different scenarios on the roading network.
5.24
Some local authorities face pressure to seal more roads, particularly with more rural developments on unsealed roads. This type of work leads to an improvement in service. Maintaining this service comes at a cost, particularly when asset condition starts deteriorating. Figure 7 shows that most capital expenditure is for replacing or renewing the assets.
5.25
On average, renewals expenditure grows 4% a year. The main cost drivers in road maintenance are the price of oil and bitumen used in the building materials (see paragraphs 2.29-2.32). The cost of good road aggregate has increased. Some local authorities are turning to alternative ways to renew assets. Tauranga City Council plans to reseal city roads on a fit-for-purpose basis from 2012/13, with an engineering assessment to decide the type of reseal. Until 2012/13, the level of service was "like for like". This meant that roads were resealed using the same material as the current surface, except that all roads carrying more than 10,000 vehicles a day were resealed with hot mix.33
5.26
The availability of contracting resources affects the timing and costs of road projects. The Canterbury rebuild could take up much of the contracting market, which might limit resources in other parts of the country.
Investment and reinvestment
5.27
In our report about the 2012-22 long-term plans, we looked at investment/reinvestment for local government as a whole – that is, capital expenditure for all activities compared to depreciation. In the same way, we have looked at the amount of investment/reinvestment of particular transport activities. By "sustainability", we mean how prepared the local authority is for longer-term uncertainties.
5.28
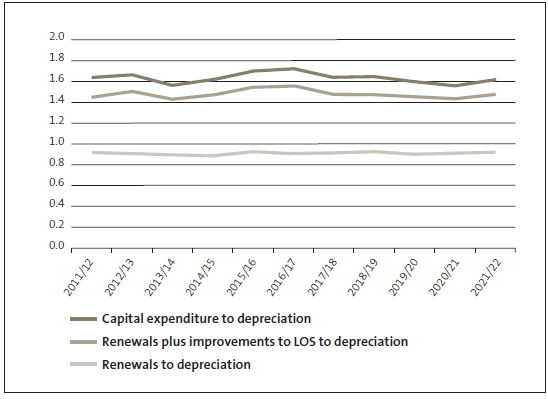
Figure 8 shows three indicators that compare capital investment to depreciation:
- all capital expenditure (demand, improvements to services, and renewals) to depreciation;
- renewals plus improvements to levels of service and renewals to depreciation; and
- renewals to depreciation.
Figure 8
Local authorities' capital expenditure to depreciation, 2011/12 to 2021/22

5.29
In Figure 8, a value of higher than 1.0 means that reinvestment is higher than depreciation. All three values are higher than total local government capital to depreciation. Overall, local authorities are well placed in terms of sustaining their intended transport activities in the long term. In general, this means that, if local authorities invest or reinvest as forecast in their long-term plans, then asset condition and capacity and services will be maintained. Local authorities assume that they will receive the NZTA subsidies that they have forecast in their long-term plans. Paragraph 5.14 discusses what happens when funding drops although sometimes, local authorities receive more NZTA funding than they expected.
Public transport
5.30
Territorial local authorities (including unitary authorities) are responsible for maintaining local roads. Unitary and regional local authorities are responsible for public transport planning for their region.
5.31
Each district has unique public transport needs. Planning for public transport needs to take into account local authorities' population growth and transport demand assumptions. Paragraphs 5.32-5.34 discuss parts of the long-term plans of Greater Wellington Regional Council and Waikato Regional Council. The examples show the challenges that these local authorities face in planning for public transport services in their regions. NZTA funding is a common issue for these local authorities because it is a significant source of revenue for funding public transport activities.
5.32
Greater Wellington Regional Council:
- is responsible for running and funding the Metlink public transport network;
- owns and maintains parts of the transport network, including trains and railway stations; and
- has contracts with companies that run train, bus, and harbour ferry services.
5.33
In 2011/12 and 2012/13, Greater Wellington Regional Council planned to spend $236 million on buying new trains, and between $79 million and $142 million refurbishing or replacing fleet.34 In the long term, Greater Wellington Regional Council seeks to provide a modern, effective, and efficient integrated public transport network that contributes to sustainable economic growth and increased productivity, while providing for social needs. This requires Greater Wellington Regional Council to continue to invest in and improve the public transport network so that it increasingly provides a viable alternative to travelling by car. Greater Wellington Regional Council has to balance the cost of providing services with demand and patronage and people being able to pay.35
5.34
Waikato Regional Council has the fourth-largest contracted public transport bus service in New Zealand.36 The Waikato region's population is expected to grow by 16% by 2031. As the population grows, public transport within Hamilton and between Hamilton and satellite towns will become more important in reducing congestion. Waikato Regional Council's long-term plan states that, in the short to medium term, there will be no further NZTA funding for public transport services outside Wellington and Auckland. The same amount of NZTA funding received in 2011/12 will be received during the first three years of the long-term plan, and there will be no inflation adjustments. Waikato Regional Council states that this is a significant change for the region because the cost of maintaining and expanding the public transport network will be met by increasing efficiencies or fares. Despite these challenges, Waikato Regional Council plans to increase patronage to offset the attrition expected after fare increases.
Integrated transport planning
5.35
The transport needs for Auckland and Western Bay of Plenty show the importance of integrated transport planning. Integrated transport planning should result in an effective and efficient long-term programme that sets out the transport needs for local roads and other transport modes, including rail, air, and sea.
5.36
Paragraphs 5.37 and 5.38 outline Auckland Council and Tauranga City Council's approaches towards integrated transport planning. The two examples show that a strategic approach needs to be taken to support or stimulate both the local and national economy.
5.37
Managing Auckland's transport network is one of Auckland Council's most significant activities. Auckland Transport – a subsidiary of the Council – carries out all transport functions and operations for Auckland apart from building and managing state highways and railway tracks. Auckland's population is expected to grow to about 2.1 million people by 2041 – this is 75% of the total population growth expected in New Zealand. Demand for travel is expected to increase by 50% (in person trips each day) while the number of freight and commercial trips is expected to double. "This improved connectedness will provide the environment needed to create an economic engine that can deliver increased wealth-generating opportunities for Auckland and New Zealand."37 Auckland Transport and NZTA have formed the Joint Traffic Operations Centre to make journeys easier by co-ordinating the management and operation of local roads and state highways in Auckland.38
5.38
In response to specific demands, Tauranga City Council prepared a SmartGrowth Strategy 2051 for sustainable growth in the Western Bay of Plenty.39 Tauranga City Council's main partners are Western Bay of Plenty District Council and NZTA. The strategy focuses on integrating land use and transport planning, and working collaboratively on strategic projects and funding plans. Tauranga City Council updated and refreshed its Integrated Transport Strategy and has consulted on a 2012-2042 strategy. This strategy considers the transport needs over a 30-year time frame and focuses on six objectives:
- economic growth and prosperity;
- safety and personal security;
- environmental sustainability;
- land use and transport integration;
- access and mobility; and
- public health.
29: See Department of Internal Affairs, Consultation on local government mandatory performance measures: The provision of roading and footpaths.
30 A territorial local authority is a city council or district council named in Part 2 of Schedule 2 of the Local Government Act.
31 The 2011/12 amounts are forecast estimates from the 2012-22 long-term plan. Local authorities were required to include their best estimate of the 2011/12 financial information at the time of preparing the 2012-22 long-term plan.
32 Lignite is a type of fuel.
33 Tauranga City Council, Long-Term Plan 2012-22, page 87.
34 Greater Wellington Regional Council Long-term Plan 2012-22, page 57, "the range represents the difference in the projected cost of refurbishing or replacing the Ganz Mavag fleet".
35 Greater Wellington Regional Council Long-term Plan 2012-22, page 57.
36 Waikato Regional Council Long-term Plan 2012-22, page 129.
37: Auckland Council, Long-term Plan 2012-22, Volume two: Our services and activities, page 96.
38: See NZTA's website, www.nzta.govt.nz.
39: Tauranga City Council, Ten Year Plan 2012-22, page 28.
page top
