Part 4: Analysing transport-related information in our audits of local authorities' 2011/12 annual reports
4.1
In this Part, we give an overview of the roads that local authorities are responsible for maintaining. The local authorities with the largest populations do not always have the largest roading networks.
4.2
We also comment on the transport-related information in local authorities' 2011/12 annual reports. We noted that:
- in 2011/12, local authorities received $938 million of NZTA transport subsidies towards their transport activities NZTA is currently carrying out a comprehensive review of the financial assistance rate that it provides to local authorities;
- local authorities had less capital expenditure on transport activities than budgeted, with significant variances for Auckland Council and Christchurch City Council; and
- local authorities' reporting of service performance has improved we continue to encourage local authorities to consider how best to present service performance information, which is an important part of telling their performance story.
The information that we considered
4.3
For their 2011/12 annual reports, local authorities reported against the financial and service performance targets set out in their 2009-19 long-term plans (formerly the Long-Term Council Community Plans).17
4.4
Local authorities set out actual financial results against the forecast ("budget" or "annual plan") financial information in their annual reports, in compliance with Part 3 of Schedule 10 of the Local Government Act 2002 (LGA). Apart from the financial statements, local authorities must include financial and service information about groups of activities.18
4.5
For the 2009-19 long-term plans, local authorities could choose which activities to include within a group of activities. Because of this, how local authorities set out or grouped their transport services varied. For example, Ashburton District Council included roading and footpath activities within "Essential Services", Marlborough District Council's "Land Transport" activities included roading and parking, and Auckland Council provides roading services through Auckland Transport.
4.6
Regional authorities grouped public transport and regional transport planning activities differently. As a result, we were unable to collect and report information that relates only to transport.
4.7
The changes resulting from the transparency, accountability, and financial management (TAFM) reform of the LGA should mean that, from 2012/13, we will be able to provide more comparable financial information on local authority transport work and results. Part 5 outlines what local authorities needed to comply with when preparing their 2012-22 long-term plans.
Where the roads and people are
4.8
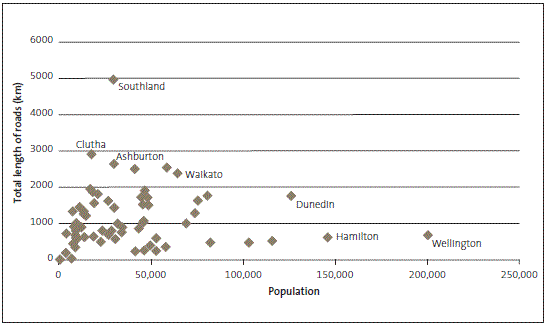
Figure 2 shows the population and total length of roads for each territorial local authority.19 For reasons of scale, we have not shown Auckland Council (with a population of 1.5 million and 7144 kilometres of roads) or Christchurch City Council (with a population of 367,900 and 2909 kilometres of roads).
Figure 2
Population and total length of roading network of territorial local authorities, 2011

Note: Populations shown are Statistics New Zealand estimates for 2011.
4.9
Figure 2 shows that territorial local authorities with the largest populations (typically the metropolitan local authorities) do not always have the largest roading networks. Rural (and often small) local authorities typically have larger roading networks to maintain and service.
4.10
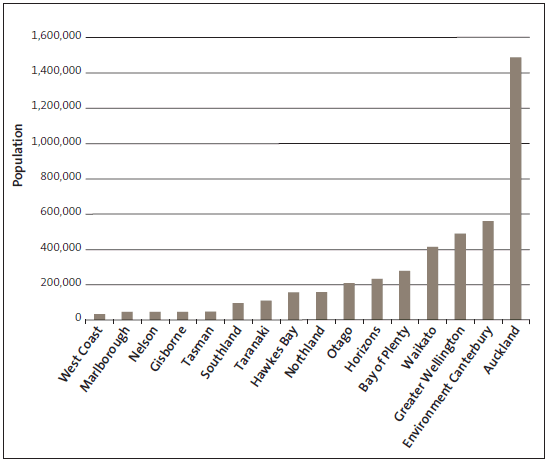
Figure 3 shows population by regional council or unitary local authorities – the population that the local authorities have to consider in their regional transport planning, which includes public transport planning and services.20
Figure 3
Population by regional council area, 2011

Source: Statistics New Zealand population estimates, 2011.
Transport subsidies
4.11
In 2011/12, local authorities received NZTA subsidies of about $938 million, which was $140 million, or 17%, higher than the budgeted $798 million. These amounts are not final because many local authorities did not disclose NZTA subsidies separately or they disclosed the actual amount but not the budget. Local authorities also carry out programmes and projects that are not subsidised by NZTA – for example, building new footpaths and new cycleways.
4.12
Three local authorities received more NZTA subsidies than budgeted:
- Auckland Council received $43 million more than budgeted because of a Crown grant of $46 million as part of the Electric Multiple Units purchase agreements;21
- Christchurch City Council received $24 million more than budgeted because of accrual of earthquake subsidies;22 and
- Hamilton City Council received $20 million of additional funding to speed up work on a ring road, which will manage congestion, support economic growth and productivity, and help people and freight to move more effectively between main transport, employment, and residential hubs.23
4.13
Auckland Transport received NZTA subsidies of $262 million in 2011/12, $95 million (27%) less than the budget of $357 million. Auckland Transport said that reduced revenue resulted from programming work more realistically and constrained funding.24 Auckland Transport and NZTA signed a Financial Assistance Variance agreement because of a $50 million reduction in subsidy, to be made up in the next two years. They agreed that, in return for this accommodation by Auckland Transport, NZTA would approve projects for subsidy over a three-year period. In 2013/14 and 2014/15, NZTA will pay its share of all approved spending on those projects.
Capital expenditure on transport
4.14
Local authorities had at least $781 million of capital expenditure for transport work and a budget of $967 million (so they spent $186 million, or 19%, less than budget). We were unable to collect transport-related capital expenditure figures from 18 local authorities because they did not separately disclose this information.
4.15
Two local authorities' actual expenditure was significantly less than budget:
- Auckland Council budgeted $335 million for capital projects but spent $306 million - a variance of $30 million - because the transport programme was reviewed and a variety of projects were reprioritised;25 and
- Christchurch City Council budgeted $134 million for capital projects but spent $32 million – a variance of $102 million. The $102 million variance is largely the result of delays in rebuilding infrastructure.26 Delays in other activities, particularly the below-ground infrastructure, delayed the streets repair programme. This work will continue in 2012/13 when the underground work has been completed. There were also delays in some projects awaiting post-earthquake assessments.
Service performance
4.16
In our June 2010 report, Local Government: Examples of better practice in setting local authorities' performance measures, we discussed the examples of better practice that we saw in local authorities' 2009-19 long-term plans. In their 2011/12 annual reports, local authorities reported their achievements against performance measures and targets.
4.17
Many local authorities have performance measures for:
- time to respond to requests for roading services;
- roading network smoothness and roughness;
- crashes, injuries, and fatalities;
- congestion for the metropolitan local authorities; and
- additional roading services that metropolitan and some larger provincial local authorities typically provide.
4.18
In our September 2011 report, Local Government: Improving the usefulness of annual reports, we set out examples of better practice in performance reporting. In that report, we said that it is important that local authorities are transparent about the costs, standards, effects, and outcomes of their work. That report focused on local authority performance reporting for the seven years 2003/04 to 2009/10. We recommended that local authorities use longer-term (five to 10 years) analysis to work out trends in performance, and analyse and evaluate the resulting information to help report on cost-effectiveness.
4.19
It is more than a year since local authorities first had the opportunity to consider our recommendations on improving performance reporting about transport activity in their 2011/12 annual reports.
4.20
We saw examples of better performance reporting in the 2011/12 annual reports (see Figures 4 and 5). We comment on some of these in paragraphs 4.21-4.22.
4.21
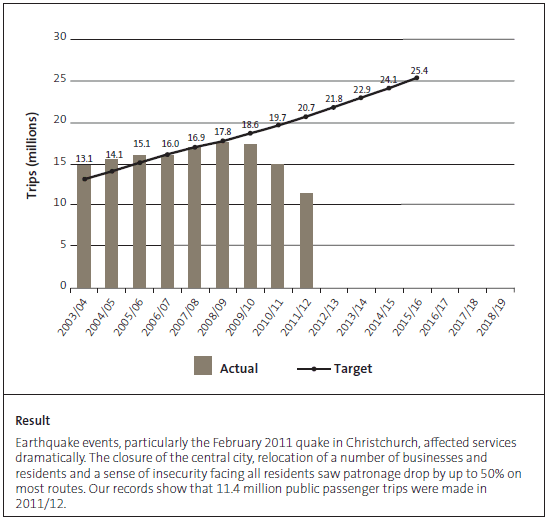
Since 2003/04, Environment Canterbury has reported the number of passenger trips on public transport in Canterbury and explained changes. Figure 4 shows the total number of passenger trips on public transport in Canterbury each year since 2003/04.
Figure 4
Total number of public passenger transport trips in Canterbury, by financial year since 2003/04

Source: Environment Canterbury, Annual Report 2011/12, page 116.
4.22
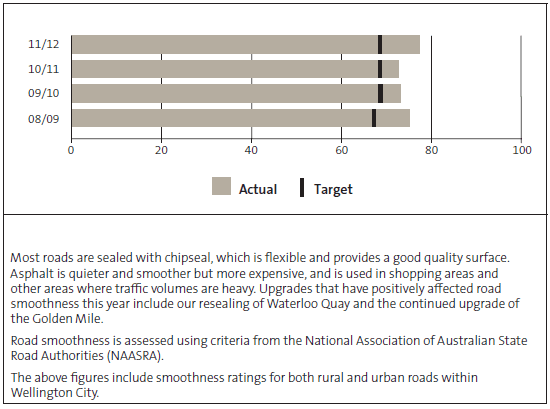
Figure 5 shows Wellington City Council's reporting on smoothness of roads against the road smoothness standards. Wellington City Council explained some of the factors contributing to its achievement for the year and disclosed data from a four-year period to allow readers to make judgements about performance.
Figure 5
Smoothness of Wellington's roads (percentage of kilometres travelled on smooth roads), 2008/09-2011/12

Source: Wellington City Council, Annual Report 2011/12, pages 72 and 74.
4.23
Local authorities are continually challenged to provide affordable services that meet communities' expectations. Comparing and communicating financial and service performance over time is essential to show effectiveness and efficiency.
4.24
We continue to encourage local authorities to consider how they can better report their performance and the outcomes they seek to achieve in a way that the public can easily understand. From 2014/15, it is expected that local authorities will use a standard set of performance measures when reporting on the delivery of five groups of activities:
- water supply;
- sewerage and the treatment and disposal of sewage;
- stormwater drainage;
- flood protection and control works; and
- roads and footpaths.27
4.25
These are requirements under the reforms to the LGA (the TAFM reforms) that are designed to promote better transparency, accountability, and financial management of local government.
4.26
This information will help the public to contribute to discussions about services and allow them to contribute more easily and effectively to local authorities' decision-making.28
4.27
The proposed performance measures focus on the following aspects:
- How safe are the local roads?
- What is the overall condition of sealed roads in the local roading network?
- Are sealed roads being maintained adequately?
- Are the footpaths that form part of the local roading network being maintained adequately?
- Does the local government entity responsible for the service provide a timely response if there is a problem?
4.28
Local authorities will be required to include the adopted mandatory performance measures in their 2015-25 long-term plans. A local authority may set other performance measures to allow the public to assess the service it has provided. Local authorities will set performance targets for each performance measure.
17: Because 2011/12 is the third year of the 2009-19 long-term plans, local authorities prepare an annual plan for 2011/12 that includes forecast information from the long-term plan and updated annual plan forecasts.
18: The Local Government Act defines a "group of activities" as one or more related activities provided by, or on behalf of, a local authority or council-controlled organisation.
19: See the NZTA database at www.smartmovez.org.nz.
20: Marlborough, Nelson, Gisborne, Tasman, and Auckland are unitary local authorities, which carry out the responsibilities of a regional council and of a territorial local authority. (Chatham Islands Council is not considered to be a unitary local authority, although it acts as a regional council for the purposes of the Resource Management Act 1991).
21: Auckland Council, Audit Report 2011/12, page 283.
22: Christchurch City Council, Annual Report 2011/12, page 111.
23: Hamilton City Council, Annual Report 2011/12, pages 6 and 47.
24: Auckland Transport, Annual Report 2011/12, page 10.
25: Auckland Council, Annual Report 2011/12, page 283.
26: Christchurch City Council, Annual Report 2011/12, page 97.
27: The performance measures will provide nationwide information on how well local authorities supply a local roading network. Being able to compare the levels of service provided by different local authorities will help communities to assess whether they need better service.
28: See Department of Internal Affairs, Consultation on local government mandatory performance measures: The provision of roading and footpaths.
page top
