Part 3: Funding in the social sector
3.1
This Part outlines the sources of revenue for entities in the social sector. It also describes the Votes and the flow of Crown funding covered by this report, including actual and projected trends from 2009/10 to 2016/17.
Income of social sector entities
3.2
Social sector entities in central government are predominantly funded through revenue from the Crown (see Figure 2). The two exceptions are the Social Workers Registration Board (the Registration Board) and Housing New Zealand. There are appropriations for the Families Commission and the Children's Commissioner under Vote Social Development, as well as for MSD (under departmental output expenses). The New Zealand Artificial Limb Service's revenue from the Crown is funding based on service provision, with contracts in place with the Accident Compensation Corporation and district health boards.
Figure 2
Revenue of social sector public entities
|
Total revenue 2009/10
$000
|
Total revenue 2010/11
$000
|
Total revenue 2011/12
$000
|
Total revenue 2012/13
$000
|
Revenue from the Crown 2012/13 | ||
|---|---|---|---|---|---|---|
| $000 | % of total revenue | |||||
| Ministry of Social Development | 1,188,290 | 1,204,336 | 1,171,028 | 1,209,241 | 1,203,636 | 99.5% |
| Children's Commissioner | 2,209 | 2,223 | 2,201 | 2,248 | 2,157 | 96.0% |
| Families Commission | 8,223 | 8,152 | 8,546 | 7,759 | 7,124 | 91.8% |
| New Zealand Artificial Limb Service | 7,673 | 8,038 | 8,104 | 8,751 | 8,373 | 95.7% |
| Social Workers Registration Board | 972 | 996 | 1,142 | 1,271 | 0 | 0% |
| Housing New Zealand | 988,000 | 1,271,000 | 1,082,000 | 1,122,000 | 665,000* | 59.3% |
Note: Figures generally exclude "other comprehensive income" identified in financial statements. * Revenue from the Crown for Housing New Zealand includes the income-related rental subsidy, Community Group Housing top-up funding, and Welcome Home Loans. The appropriation income only was $28 million, or 2.5% of total revenue.
3.3
The Registration Board receives no funding from the Crown. It must cover its costs through the application, registration, and practising fees that it charges. In the past, we have considered whether the Registration Board's reliance on fees raised concerns about its financial sustainability. As part of our 2009/10 annual audit, we considered whether the Board's going concern assumption was appropriate. We concluded that it was.
3.4
Of Housing New Zealand's total revenue of $1,122 million in 2012/13, 92% came from rental income, both directly from tenants ($400 million) and from the income-related rental subsidy ($633 million).6 The latter is the Crown's reimbursement for the difference between what Housing New Zealand receives from its tenants and what it would receive from market rents. Total revenue from the Crown, including the rental subsidy, amounted to $665 million (see Figure 2) but the appropriation income was only $28 million (2.5% of total revenue).
Where does Crown funding go and who has accountability?
3.5
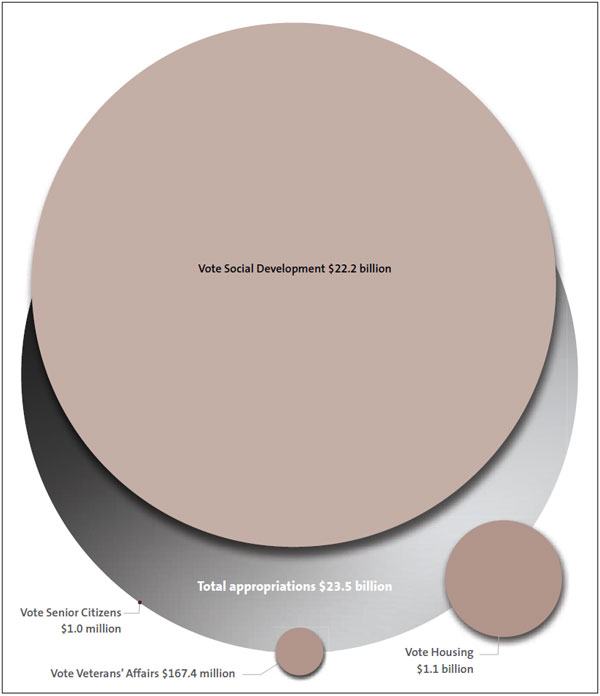
The social sector comprises four Votes, with total appropriations of just over $23.5 billion for 2013/14 (see Figure 3):
- Vote Social Development ($22.2 billion);
- Vote Senior Citizens ($1.0 million);
- Vote Veterans' Affairs – Social Development ($167.4 million); and
- Vote Housing ($1.1 billion).
3.6
MSD administers the first three of these Votes. MSD's chief executive agrees output plans with the Ministers responsible for Social Development, Senior Citizens, and Veterans' Affairs. Vote Senior Citizens covers services from the Office for Senior Citizens in MSD. Because of its small size, we do not analyse it in detail.
3.7
MBIE is responsible for Vote Housing, agreeing output plans with the Ministers of Housing and Building and Construction.
Figure 3
Relative size of total appropriations for Vote Social Development, Vote Senior Citizens, Vote Veterans' Affairs, and Vote Housing, 2013/14
Vote Social Development
3.8
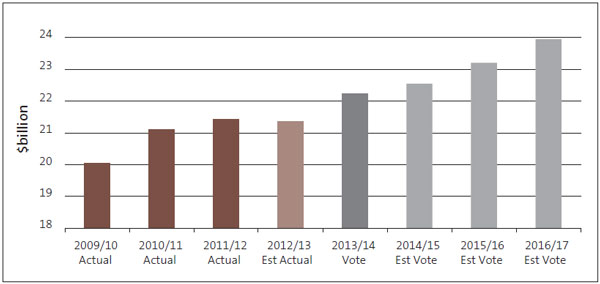
Figure 4 shows the trend in total appropriations for Vote Social Development since 2009/10 and the projected trend to 2016/17.
Figure 4
Trends in appropriations: Vote Social Development
Source: Social Development and Housing Sector, Information Supporting the Estimates of Appropriations 2013/14.
3.9
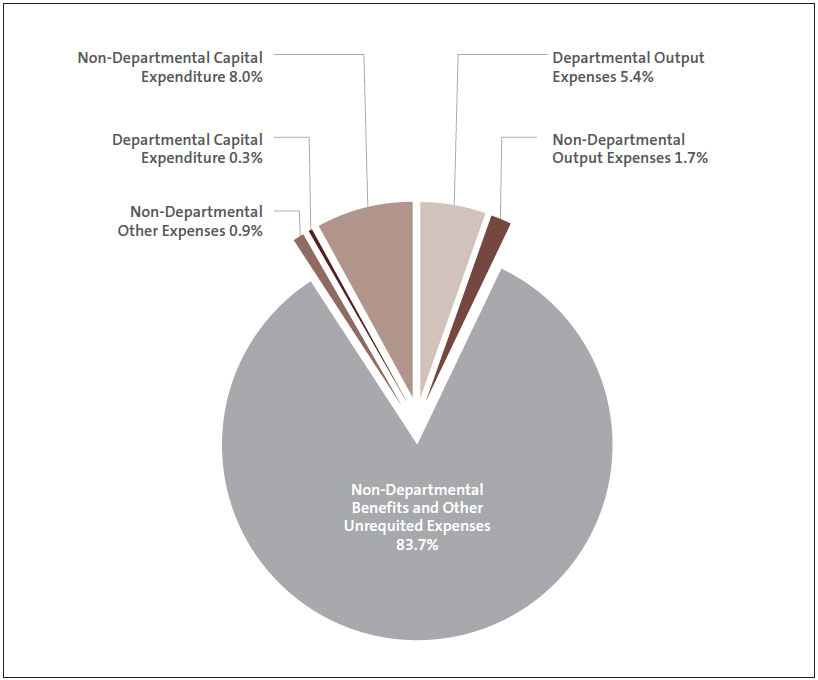
Most of Vote Social Development for 2013/14 ($18.6 billion, or 83.7%) is appropriated for "benefits and other unrequited expenses", as shown in Figure 5. These are payments that New Zealanders are entitled to, if they satisfy the eligibility criteria, without having to provide a service in return – for example, New Zealand Superannuation and welfare benefits. New Zealand Superannuation payments alone account for $10.894 billion in 2013/14, which is 49% of the funding appropriated under the Vote.
Figure 5
Appropriation categories for Vote Social Development, 2013/14
Source: Social Development and Housing Sector, Information Supporting the Estimates of Appropriations 2013/14.
3.10
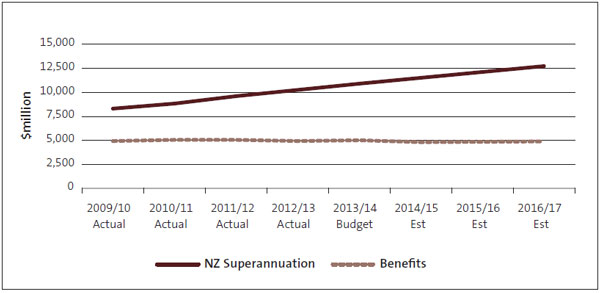
Appropriations for "benefits and other unrequited expenses" have increased by 17.4% since 2009/10. They are projected to increase by a further 8.9% between 2013/14 and 2016/17. The increase is largely explained by the growth in New Zealand Superannuation. The relevant appropriation has increased by 31% between 2009/10 and 2013/14. This reflects annual inflation adjustments and that a larger number of New Zealanders have reached the age of entitlement (our recent report, Using the United Nations' Madrid indicators to better understand our ageing population, highlights New Zealand's population trend). That increase compares to an increase of only 2.4% for appropriations covering benefits. Figure 6 shows these trends.
Figure 6
Trends in "non-departmental benefits and other unrequited expenses"
Source: Social Development and Housing Sector, Information Supporting the Estimates of Appropriations 2013/14. Estimates for 2014/15–2016/17 are based on MSD figures.
3.11
Budgeted departmental output expenses ($1.2 billion in 2013/14, which is 5.4% of the Vote) include MSD's departmental administration costs. This, together with non-departmental output expenses, covers the services MSD provides, or sources from others, to meet the Government's priorities.
3.12
MSD purchases services costing about $570 million from third parties. A significant portion of this is classed as departmental expenses, for which the Chief Executive has exercised his discretion to procure services from external providers. These include family and community services, support for youth, training, and child protection services. In the future, it will also include externally contracted services for beneficiaries.
3.13
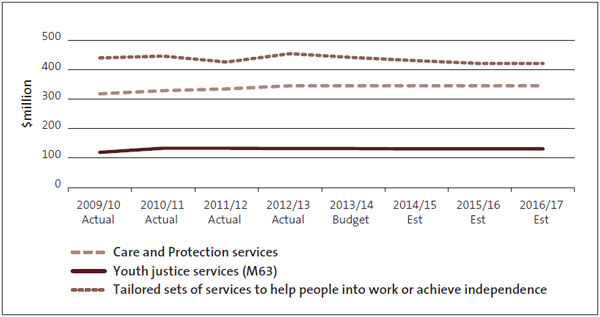
MSD's outcomes framework maps appropriations against Government priorities. Three appropriations that are closely linked to the Better Public Services goals of "Reducing long-term welfare dependence", "Supporting vulnerable children", and "Reducing Crime" account for $919 million, or 76.5%, of the total budgeted departmental output expenses in 2013/14. Despite their significance for the Government's priorities, they have increased by only 4.7% since 2009/10 (see Figure 7), which is less than the average for the total Vote. The three appropriations are:
- Tailored Sets of Services to Help People into Work or Achieve Independence: $441.6 million;
- Care and Protection Services: $345.5 million; and
- Youth Justice Services: $131.9 million.
Figure 7
Trends in selected output expenses appropriations
Source: Ministry of Social Development.
Vote Veterans' Affairs – Social Development
3.14
Vote Veterans' Affairs – Social Development provides for the processing and payment of the pension for war veterans. The Vote is dominated by "benefits and other unrequited expenses". For 2013/14, $167.0 million is appropriated for Veterans' Pensions, and $440,000 for Departmental Output Expenses. The Vote is declining because lower numbers of veterans receive the veterans' pension. It is estimated that, by 2016/17, $147.9 million will be paid in veterans' pensions.7
Vote Housing
3.15
Although the Social Services Committee has examined Vote Housing in recent years, the Vote supports several government priorities and outcomes, some of which are outside the social sector. For example, the Vote supports the outcome of "more productive and internationally competitive businesses".
3.16
Decisions will be needed on the Vote structure and on appropriations when the social housing assessment function transfers to MSD in 2014.
3.17
For Vote Housing, the share of "benefits and other unrequited expenses" is $20.5 million in 2013/14, or 1.8% of the total. Most of this ($19.0 million) is for a KiwiSaver Deposit Subsidy. Non-departmental output expenses account for $686.2 million in 2013/14. Of this, the income-related rent subsidy for eligible Housing New Zealand tenants ($662.2 million) represents 59.5% of the Vote (see Figure 8). Of the rest of the Vote, $218.0 million (19.6%) is for capital expenditure.
Figure 8
Vote Housing
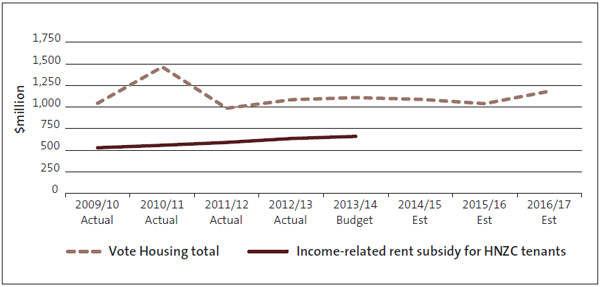
Source: Social Development and Housing Sector, Information Supporting the Estimates of Appropriations 2013/14. Note: There was a significant increase in "other expenses" in 2010/11 related to the Weathertight Financial Assistance Package of $567 million.
Financial support for rent
3.18
The Accommodation Supplement provides an income- and asset-tested subsidy for housing costs. It is administered by MSD's Work and Income business unit. The 2013/14 appropriation for the Accommodation Supplement amounts to nearly $1.2 billion. The $662 million income-related rent subsidy (funded from Vote Housing) and the Accommodation Supplement (funded from Vote Social Development) constitute the most significant central government appropriations for social housing. Together, these appropriations amount to $1.85 billion in 2013/14.
6: This is appropriated under Vote Housing – see paragraph 3.17.
7: There are also appropriations relating to Veterans' Affairs in Vote Defence Force, covering the War Disability Pension. Before July 2013, these appropriations were included in Vote Veterans' Affairs – Defence Force. They are now integrated into Vote Defence Force. Appropriations total $156.2 million for 2013/14.
page top
