Part 4: Analysis of insurance for local government assets
4.1
In this Part, we set out our analysis of the information that we collected about insurance of assets from local government entities. We look at:
- the value of assets in local government;
- the extent of insurance for those assets;
- why some assets are not insured;
- the level of insurance cover for insured assets in local government;
- commonly used insurance providers; and
- changes in insurance in local government after 2010.
Value of local government assets
4.2
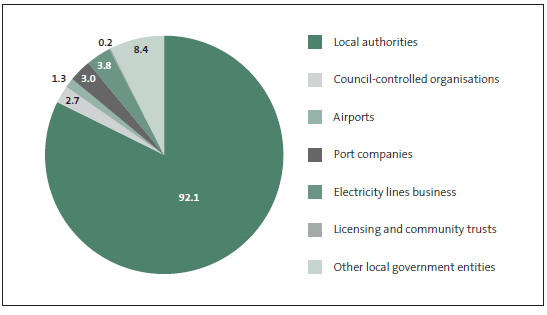
We collected information about how 228 local government entities insure their assets. Appendix 2 sets out the number and types of these entities. These public entities' financial statements have assets recorded at about $112 billion. We refer to this as the carrying value of those assets. As Figure 17 shows, various types of public entities hold these assets.
Figure 17
Carrying value of local government assets, in billions of dollars, by type of entity

4.3
Figure 17 shows that local authorities own most local government assets. Local authorities own about 80% of the carrying value of assets. Local authorities have a unique arrangement with central government in terms of insurance. The 1991 Disaster Recovery Plan states that central government will pay up to 60% of restoration costs for water and sewerage services after a catastrophe.2
4.4
This arrangement is conditional on the local authority being able to show that the damaged assets had been properly maintained and that the local authority can meet the remaining 40% through other means (by setting aside reserves, insurance, or a mutual assistance scheme). We expected that many local authorities' assets would not have insurance cover in the traditional sense because the central government provides significant cover. Information from our auditors of local authorities supports this.
Extent of insurance cover for local government assets
4.5
We found that a high proportion of local government assets have no insurance cover. Slightly more than half of local government entities had at least one asset type without any insurance cover. Figure 18 shows that these asset types were most commonly land and landfill, transport infrastructure, and underground assets.
Figure 18
Assets without insurance cover in local government, by type of asset

4.6
We found that about 60% of the carrying value of assets in local government does not have any insurance cover. The proportion of assets that are insured (around 40%) costs about $100 million a year in insurance premiums.
4.7
Local authorities, electricity lines businesses, and other local government entities hold many uninsured assets. A particularly high number of electricity lines businesses have at least one asset type without insurance cover. In general, these are some of their electricity generation and distribution systems. The common reasons for this are that the cost of insurance outweighs the assessed risk and that they manage the risk with their capacity to borrow.
4.8
Three local government entities Auckland Council, Christchurch City Council, and Watercare Services Limited hold a significant proportion of the uninsured assets. Figure 19 outlines for these three public entities the types of asset without insurance and the reason why.
Figure 19
Types of assets that Auckland Council, Christchurch City Council, and Watercare Services Limited hold without insurance and reasons why
| Public entity | Types of asset not insured | Reason they are not insured |
|---|---|---|
| Auckland Council (About $20 billion of assets are not insured.) |
Land, landfill, transport infrastructure, stormwater and flood protection schemes, playground equipment, streetscapes, lighting, monuments, and other non-building assets in the open. | Assessed that the cost of insurance exceeds the risks. Auckland Council has done a feasibility study and is looking at how to further self-insure assets. Auckland Council quantifies and assesses risks to assets and models the effects of natural disasters on assets. Therefore, decisions are influenced by scientific data, financial capability to retain risk, and risk management initiatives. |
| Christchurch City Council (Value of uninsured assets is difficult to work out because of complexities around the earthquakes.) |
Land, transport infrastructure, stormwater and flood protection schemes, water supply systems, wastewater and sewerage systems, and some buildings. | Could not get insurance. Christchurch City Council has the capacity to borrow to fund any loss or damage. |
| Watercare Services Limited (About $5 billion of assets are not insured.) |
Land and underground infrastructure assets (water supply, wastewater, and sewerage systems). | Assessed that the cost of insurance exceeds the risks. Watercare Services Limited has the capacity to borrow to fund any loss or damage. |
4.9
If we exclude Auckland Council, Christchurch City Council, and Watercare Services Limited, the percentage of local government assets that are uninsured drops significantly. However, about half of the carrying value of local government assets is not insured. Many local authorities do not have insurance cover for a significant proportion of their assets.
4.10
Having assets without insurance cover is not necessarily cause for alarm. There are other ways to manage risk. Therefore, it is important to look at the common reasons for not having insurance for assets.
Reasons why some assets in local government have no insurance cover
4.11
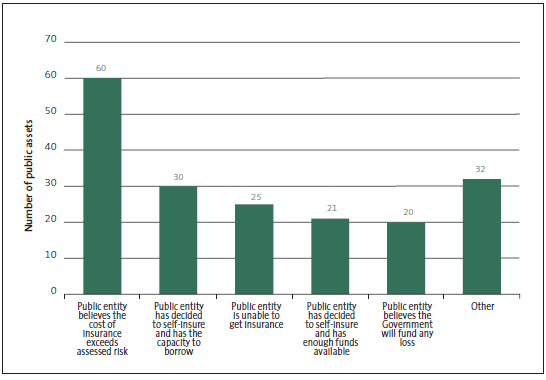
The most common reason why assets in local government, other than land, have no insurance cover was that the cost of insurance is higher than the assessed risk and the public entity has decided to self-insure, either because it has the capacity to borrow or has enough funds available. Figure 20 shows the common reasons why some local government assets have no insurance cover.
Figure 20
Reasons why some local government assets have no insurance cover

4.12
The cost of insurance exceeding assessed risk shows that public entities are carrying out risk assessments to work out whether insurance provides value for money. It is good practice to carry out such assessments. We have not tested the quality of risk assessments for those public entities that believe the cost of insurance is higher than the assessed risk.
4.13
A decision to self-insure because of the capacity to borrow is unique to public entities that can borrow. Public entities sometimes use this ability to help manage risks. Being able to borrow funds was a common reason why public entities got insurance that did not cover the full carrying amount of the assets.
4.14
Another reason for a public entity to have no insurance cover was that the government agreed to cover 60% of restoration costs for water and sewerage assets. Some information about this, along with how the Local Authority Protection Programme Disaster Fund started is set out in the box headed "What we found out from Civic Assurance".
Level of cover for insured assets in local government
4.15
The results show that the total sum insured is slightly more than the carrying value of local government assets that insurance policies cover. This could mean that the total insurance cover for these assets is enough. However, it also might not, because the cost to replace these assets is likely to be significantly more than their carrying value.
4.16
Even though the sum insured value is greater than the carrying value of insured assets on a total basis, the opposite applied for about 20% of insurance policies. Some electricity lines businesses do not insure the full carrying value of their assets because they partly manage the risk with their ability to borrow, and the assets being widely dispersed means that the required insurance cover is assessed as lower.
Commonly used insurance provider for local government entities
4.17
We found that the insurer that local authorities most commonly used was New Zealand Local Government Insurance Corporation Limited, trading as Civic Assurance. Civic Assurance is owned by local government and supplies local government with a range of financial services,3 including insurance and the Local Authority Protection Programme Disaster Fund (LAPP).
| What we found out from Civic Assurance* |
|
Insurance Civic Assurance and its predecessors have provided insurance and financial services to local authorities since 1941. Most local authorities are shareholders. Civic Assurance offers a range of insurance products to local authorities,† but does not offer material damage cover for above-ground property. The Canterbury earthquakes had a significant effect on Civic Assurance. Before the earthquakes, Civic Assurance had built a sizeable insurance portfolio and reinsurance programme. After the earthquakes, more than 900 claims were submitted and, as at 31 December 2012, the outstanding claims liability was more than $800 million. Most of this amount is covered by Civic Assurance's reinsurance arrangements, so the reinsurers bear a significant part of the earthquake claims costs. However, after the earthquakes, Civic Assurance was not able to renew its property reinsurance programme or secure suitable reinsurance from any other source from 1 July 2011. As a consequence, Civic Assurance's claims payable credit rating was reduced in 2011 to "B++-, negative watch" and it has been unable to offer material damage cover since then. The Civic Assurance group made a loss before tax of about $1.6 million‡ for the year ended 31 December 2012. Most of this loss was because of the cost of dealing with the Canterbury earthquake claims. More costs will be incurred in 2013 because of the Canterbury earthquake claims. Civic Assurance issued an offer to its shareholders and other local authorities in late 2012 to subscribe for shares in the company. This offer is to close in December 2013 unless extended. Several matters need to be resolved before Civic Assurance can again provide material damage cover for local authorities. Local Authority Protection Programme Disaster Fund The LAPP is a "cash accumulation mutual pool" set up and administered by Civic Assurance. Several local authorities are members. It is not compulsory for local authorities to join. It is a choice based on their assessment of risks and the best way to mitigate those risks. How the LAPP started Until 1991, central government took full responsibility for all costs associated with the restoration of water and sewerage services after natural disasters. The 1991 Disaster Recovery Plan stated that central government would pay a maximum of 60% How the LAPP works Members make an annual contribution to the LAPP in return for cover for the cost of restoring their infrastructure as a result of a damaging event. Contributions are set at a level that covers the expected risk, administration costs, and re-insurance premiums. In some years the annual contribution includes a significant component for building the LAPP. This allows the LAPP to do more self-insurance. Members pay an annual contribution based on factors such as the risk or exposure of the member to a damaging event in its region, the asset value of the member, and the state of repair, maintenance, and condition of the member's infrastructure. Insurance claims (distributions) are met from a combination of assets in the LAPP and reinsurance purchased from the global market. Before making a distribution, it must be established that the loss or damage is to the infrastructure and that the loss or damage was caused by the damaging event. The LAPP also provides a risk management programme. This means that each member is visited at least every four years for a review of their infrastructure assets covered by the LAPP. Advantages of the LAPP An assessment of key risks for local authorities for assets covered by the LAPP shows that the risk of asset damage or loss because of a disaster in New Zealand is very low, but with relatively high impact. Options to transfer some of this risk include joining the LAPP or using a private insurer or self-insurance through setting aside its own disaster reserves. According to Civic Assurance, some of the LAPP's advantages over the alternatives are:
Before the Canterbury earthquakes, member contributions and excesses had generally been falling while values covered had more than doubled. Effects of the Canterbury earthquakes on the LAPP The Canterbury earthquakes have had a significant effect on the LAPP. The LAPP had just the one automatic reinstatement, so although the September 2010 and February 2011 earthquakes were covered the 13 June 2011 earthquake was not covered by the LAPP's reinsurers. There are uncertainties surrounding the amount of claim liabilities and the related reinsurance recoveries arising from the Canterbury earthquakes. As at 30 June 2012, gross outstanding claims liabilities for Canterbury totalled $454 million. This was before receiving any reinsurance recoveries for these claims. After reinsurance and other recoveries, the net outstanding claims liabilities amounted to $24.2 million. The future of the LAPP The LAPP is dependent on its ability to retain members and rebuild its fund. It agreed a significant increase in members' contributions for 2011/12, and has opted for a mix of self-reinsurance and reinsurance cover, at least for 2012/13. |
* The purpose of this example is to provide some depth to the analysis by showing the experience of a specialist insurer, not to judge the validity or appropriateness of specialist insurers.
† These products include Material Damage, Business Interruption, Motor Vehicle, Contractors All Risks, Marine Cargo and/or Hull, Electronic Equipment, Fidelity Guarantee, Personal Accident, Forest and Rural Fire Costs, Civil Defence Expenditure, Election Expenses, Machinery Breakdown, Boiler Explosion, Professional Indemnity, Public Liability, and Travel.
‡ This amount is from the 2012 financial statements of New Zealand Local Government Corporation Limited, trading as Civic Assurance (rounded to the nearest $100,000).
![]() Note 24 to Civic Assurance's financial statements for the year ended 31 December 2012 explains some of those issues.
Note 24 to Civic Assurance's financial statements for the year ended 31 December 2012 explains some of those issues.
![]() The 60/40 split between central and local government is set out in the Guide to the National Civil Defence Emergency Management Plan. It excludes Council-controlled organisations.
The 60/40 split between central and local government is set out in the Guide to the National Civil Defence Emergency Management Plan. It excludes Council-controlled organisations.
Changes in insurance in local government after 2010
4.18
Local government entities have faced significant changes to their insurance because of changes in the insurance market during the past couple of years.
4.19
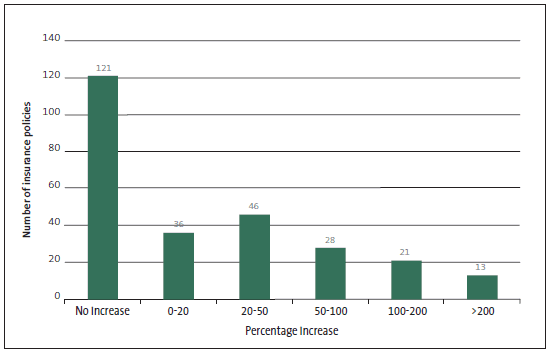
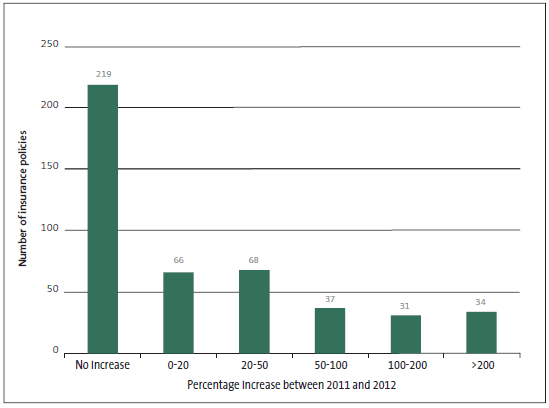
We collected information about the changes in insurance policies between 2011 and 2012. For slightly less than 40% of the insurance policies that we collected information about, there was an increase of more than 20% in the insurance premiums. Figure 21 shows how much premiums have increased in local government.
Figure 21
Increase in premiums for insurance policies in local government, 2011 to 2012

4.20
Between 2011 and 2012, increases in premiums were much more common than increases in excess or additional policy exclusions. Local authorities and airports had the highest proportion of insurance policies that had an increase in excess, compared with other local government entities. Local authorities also had the highest percentage of policies with additional policy exclusions. This shows that most local authorities have had to rearrange their insurance policies by paying more in premiums, accepting a higher excess, and/or accepting additional policy exclusions.
4.21
For more than half of the insurance policies in local government, public entities expected no significant changes for 2012/13. This showed that public entities believed that the insurance market had, for the most part, taken the effects of the Canterbury earthquakes and other global events into account.
2: The 60/40 split between central and local government is set out in the Guide to the National Civil Defence Emergency Management Plan. The split excludes council-controlled organisations.
3: These services include insurance, Riskpool (professional indemnity and public liability protection), KiwiSaver, and the LAPP.
page top
