Part 2: The five local authorities
2.1
This Part sets out, for each of the five local authorities:
- the forecast development and financial contributions revenue and capital expenditure to meet additional demand for the 10 years to 2021/22;
- the approach to funding growth; and
- the basis for how growth charges are set.
Local authorities’ forecast growth charges and capital expenditure to meet additional demand
2.2
Figures 5 to 9 reflect the forecast development and financial contributions revenue, and forecast capital expenditure to meet additional demand from the five local authorities’ 2012-22 long-term plans. We extracted these amounts from the funding impact statements9 in those long-term plans. Each local authority has different forecast revenue and expenditure profiles over the 10 years to 2021/22, and we have already highlighted several possible reasons for this in paragraphs 1.17 and 1.18.
2.3
In addition, we note the following:
- The forecast development and financial contributions revenue in the funding impact statements align with each local authority’s development and/or financial contribution policies.
- The capital expenditure to meet additional demand in the funding impact statements may be different from that reflected in each local authority’s development and/or financial contribution policies.
2.4
In preparing their 2012-22 long-term plans, local authorities had to classify their capital expenditure into three categories in the funding impact statement: meeting additional demand, improving levels of service, or replacing existing assets. A local authority first had to work out, for each capital project, the percentage attributable to each of the three categories. A local authority then had to classify the project according to its “primary purpose” or the category with the highest percentage. For example, if 50% of the project is to meet additional demand, 40% to improve levels of service, and 10% to replace existing assets, then the project is classified in the funding impact statement as 100% to meet additional demand.
Summary of typical growth charges for four local authorities
2.5
In Figure 4, we have set out for four10 of the five local authorities their typical growth charge for an infill and greenfield development based on constructing a three-bedroom house in a residential urban area. The typical charges reflected in Figure 4 are indicative only. The actual growth charge will vary depending on the type of development, geographical location, and services available to that development.
Figure 4
Typical growth charges for four local authorities
| Transport $ | Water supply $ | Waste water $ | Storm water $ | Reserves $ | Community infra-structure $ | Ecological protection $ | Total growth charge $ |
|---|---|---|---|---|---|---|---|
| Tasman District Council | |||||||
| Infill and greenfield development | |||||||
| 894 | 6,596 | 8,118 | 5,149 | * | * | 0 | 20,757 |
| Tauranga City Council | |||||||
| Infill development | |||||||
| 292 | 3,474 | 7,404 | 0 | 418 | 757 | 0 | 12,345 |
| Greenfield development | |||||||
| 5,391 | 5,150 | 8,604 | 4,419 | 1,247 | 955 | 0 | 25,766 |
| Western Bay of Plenty District Council | |||||||
| Infill and greenfield development | |||||||
| 9,296 | 4,103 | 6,608 | 4,846 | 6,753 | 0 | 501 | 32,107 |
| Marlborough District Council | |||||||
| Infill development | |||||||
| 524 | 4,322 | 7,050 | 650 | 4,696 | 2,700 | 0 | 19,942 |
| Greenfield development | |||||||
| 786 | 4,322 | 7,050 | 650 | 9,391 | 2,700 | 0 | 24,899 |
* The reserves and community infrastructure financial contribution charge is based on 5.62% of the value of the new lot created. Maximum charge assuming one household unit of demand. No financial contribution payable on residential buildings if nothing was paid at the time the lot was created.
Tasman District Council
2.6
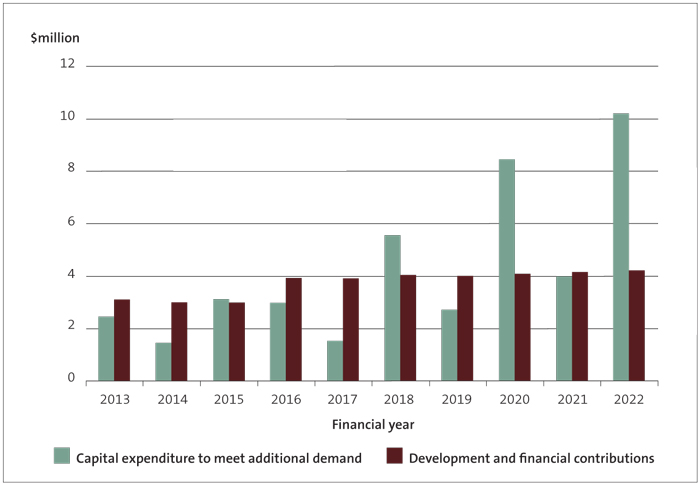
Tasman District Council has forecast that it will collect $42.2 million in development and financial contributions, and will spend $37.2 million on capital expenditure to meet additional demand, during the next 10 years (see Figure 5).
Figure 5
Tasman District Council’s forecast capital expenditure to meet additional demand, and development and financial contributions, 2012/13 to 2021/22
2.7
The average development and financial contributions revenue as a percentage of total operating income for the next 10 years is 3%.
2.8
The typical growth charge for each household “unit of demand” is $20,75711 for a three-bedroom house (same charge for infill or greenfield development in a residential urban area). This charge assumes that all services are available and provides no credit for prior payment or any allowance for the bare titles.
How Tasman District Council approaches funding for growth
2.9
One of the Council’s main sources of funding for growth-related assets is development contributions. The Council intends that developers bear the cost of the increased demand that development places on the district’s infrastructure.
2.10
The Council’s development contributions methodology apportions costs to reflect those who cause the need for the growth-related infrastructure and those who benefit (for example, existing ratepayers) from new or additional infrastructure or infrastructure with increased capacity. Hence, development contributions allocate the cost for expanded infrastructure services away from general ratepayers to developers and new home builders – those who drive the need for new infrastructure or infrastructure with increased capacity.
2.11
New subdivisions are charged for services, including roading, water, wastewater, and stormwater when available. The Council recently made changes to its policy and does not charge on residential buildings, except where no prior contribution had been received at the time of title creation.
2.12
The Council imposes financial contributions for reserves and community infrastructure purposes under the Tasman Resource Management Plan.
How Tasman District Council sets its growth charges
2.13
The Council has a district-wide approach to growth charges rather than a “per catchment” or community-by-community approach. The Council considers that this is more appropriate for its geographically large and relatively dispersed population, where costs vary considerably between different communities. This approach results in some cross-subsidisation between communities. The Council charges connection fees as well as development contributions. These fees are designed to recover capital costs already incurred by the Council.12
2.14
Contributions are based on household units of demand (HUDs). Multiples of HUDs are charged for commercial and larger residential developments where appropriate.
2.15
The Council adjusts the value of the development contribution on 1 July each year using the annual change in the Construction Cost Index. The Council intends to use the Producers Price Index13 to annually adjust the value of the development contribution charges when it next reviews its development contributions policy.
Tauranga City Council
2.16
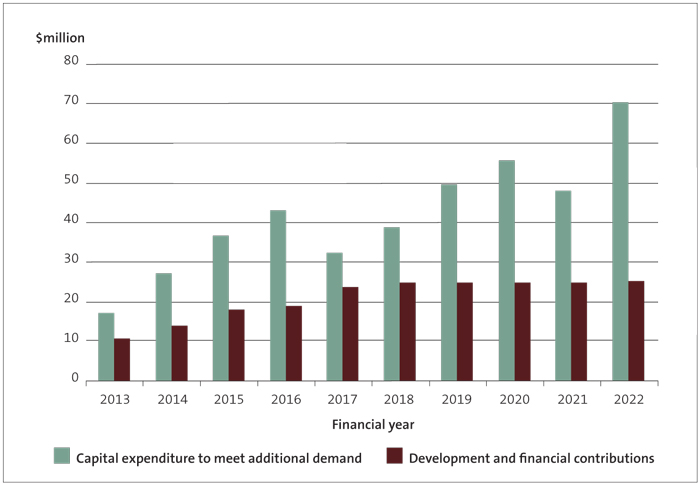
During the next 10 years, Tauranga City Council has forecast that it will collect $209.0 million in development and financial contributions, and will spend $418.4 million on capital expenditure to meet additional demand (see Figure 6).
Figure 6
Tauranga City Council’s forecast capital expenditure to meet additional demand, and development and financial contributions, 2012/13 to 2021/22
2.17
The average development and financial contributions revenue as a percentage of total operating income for the next 10 years is 10%.
2.18
The typical growth charge for each household unit equivalent is $12,345 (infill development) and $25,766 (greenfield development) for a three-bedroom house in a residential urban area.
How Tauranga City Council approaches funding for growth
2.19
The Council’s main method for funding growth-related assets is development contributions. The Council’s underlying rationale is that those who cause growth should pay for it. In other words, growth should pay its own way.
2.20
The Council considers that growth charges ensure that new development contributes fairly to the funding of Tauranga’s infrastructure and service requirements:
The Council also recognises that it needs to take a fair and equitable approach when considering benefits. The Council’s development contributions policy states that the Council:
… regards in relation to each activity – the distribution of any benefits between the community as a whole, any identifiable part of the community and individuals, and the period over which benefits are expected to occur. This is reflected in the cost allocation methodology. For example, where people in the existing community may get benefit from an improved level of service.14
How Tauranga City Council sets its growth charges
2.21
The Council charges both city-wide development contributions and local development contributions (that is, catchment-based development contributions). The city-wide development contributions are charged to recover the capital costs for assets that service growth across the whole city. Local development contributions are charged to recover the capital costs for assets that service growth in particular catchments.
2.22
City-wide development contributions are differentiated based on a range of development types. The development types are: one-bedroom houses, two-bedroom houses, three-bedroom (or bigger) houses, business activities, low-demand business activities, and community organisations. Local development contributions are differentiated based on geographical catchment. There are 10 catchments, each having their own individual local development contribution charges.
Western Bay of Plenty District Council
2.23
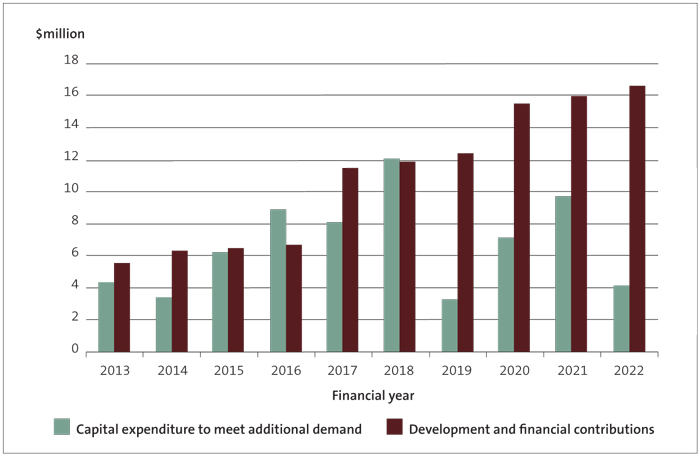
Western Bay of Plenty District Council has forecast that it will collect $108.8 million in financial contributions and will spend $67.2 million on capital expenditure to meet additional demand during the next 10 years (see Figure 7).
Figure 7
Western Bay of Plenty District Council’s forecast capital expenditure to meet additional demand, and financial contributions, 2012/13 to 2021/22
2.24
The average financial contributions revenue as a percentage of total operating income for the next 10 years is 11%.
2.25
The typical growth charge for each household equivalent is $32,107 for a three-bedroom house in the Katikati urban area (same charge for infill or greenfield development).
How Western Bay of Plenty District Council approaches funding for growth
2.26
The Council’s approach is that growth should pay for growth. This is consistent with its general funding policy of recovering costs from users of a service or from those who create the need for a service. Financial contributions are a key part of this approach – making sure the new development is not subsidised by the wider community and that costs are fairly allocated between present and future ratepayers.
2.27
Financial contributions serve several other objectives as well, including:
- efficient utilisation of the district’s infrastructure; and
- influencing the timing of development to ensure that it does not outstrip the Council’s ability to fund infrastructure.
2.28
The Council’s policy includes a provision to reduce or waive financial contributions if it can be demonstrated that there would be detriment to the community in applying the charges under the policy.
2.29
The Council charges financial contributions for the effects of development on water supply, wastewater, stormwater, transportation, recreation, and ecological protection. The Council does not charge a recreation financial contribution on commercial and industrial development.
How Western Bay of Plenty District Council sets its growth charges
2.30
The Council’s financial contributions are based on catchments for network infrastructure. This approach clearly links development to the need for infrastructure and the cost of providing it, and reflects the mix of small towns and rural areas in the district. This is because rural properties do not have access to reticulated wastewater or stormwater networks and may not have access to Council water supply.
2.31
The Council also charges district-wide financial contributions for strategic transport links, recreation facilities, and ecological protection. This recognises that the benefit of this expenditure is not confined to particular properties or local catchments.
Marlborough District Council
2.32
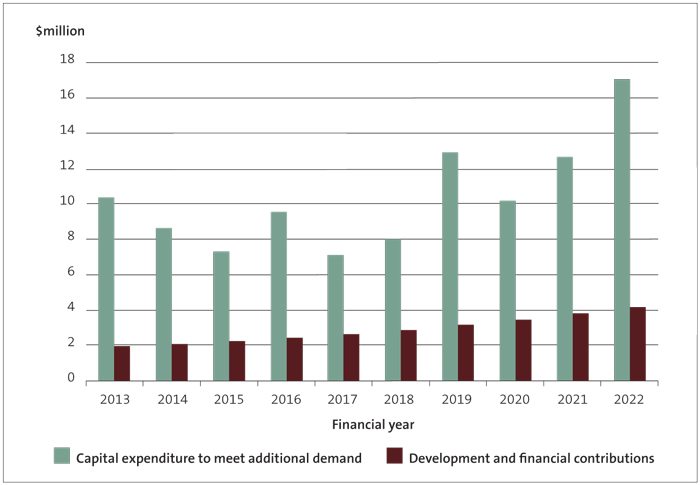
Marlborough District Council has forecast that it will collect $28.8 million in development and financial contributions, and will spend $103.8 million on capital expenditure to meet additional demand, during the next 10 years (see Figure 8).
2.33
The average development and financial contributions revenue as a percentage of total operating income for the next 10 years is 3%.
2.34
The typical growth charge for each household unit equivalent is $19,942 (infill development) and $24,899 (greenfield development) for a three-bedroom house in a residential urban area. In addition, the Council currently remits 34% of the difference between the amount charged for development contributions and financial contributions reflecting the transition from charging under the financial contribution policy approach to a development contribution policy approach.
Figure 8
Marlborough District Council’s forecast capital expenditure to meet additional demand, and development and financial contributions, 2012/13 to 2021/22
How Marlborough District Council approaches funding for growth
2.35
The Council primarily uses development contributions, but also uses financial contributions in particular circumstances (see paragraph 2.37). The Council believes that costs should be borne by those who cause them, and that recovering those costs encourages efficient allocation of resources in the district. If developers are aware of the costs of the community facilities required for new developments in advance, they can take those costs into account when making development decisions.
How Marlborough District Council sets its growth charges
2.36
The Council charges development levies for commercial and industrial purposes, for residential purposes, and to fund reserves. Growth costs are apportioned over time so that members of the growth community pay only for the capacity they use, and so an appropriate proportion of those costs are allocated to future generations.
2.37
The Council charges financial contributions to government departments and Crown entities that are not bound by the Local Government Act for:
- connections and upgrades to sewerage reticulation;
- water supply and stormwater collection and disposal networks;
- roads; and
- reserves.
2.38
In situations where there are multiple developers looking to develop in a particular area, the Council has undertaken the activities that developers normally undertake to achieve more:
- integrated and structured development;
- efficient construction of services; and
- consistent standards of development.
2.39
The Council recovers those costs by also charging zone levies under the Resource Management Act. Zone levies are generally not applied to single-developer subdivisions, as developers usually meet the normal costs of subdivision. The exception is where the demand for a piece of infrastructure is generated solely by the development in question. The cost of this infrastructure is excluded from the calculation of development contributions so the developer is not charged twice for recovering the infrastructure cost.
2.40
The Council intends to charge development contributions instead of financial contributions for most parts of its district, except for its north-west zone (area) and parking contributions. The Council’s development contributions policy took effect on 1 July 2009.
2.41
The Council calculates its charges for each catchment area and each activity, based on the expected scale and timing of the capital works needed to service growth.
2.42
Development contributions are adjusted annually in line with movements in the Producers Price Index.
Timaru District Council
2.43
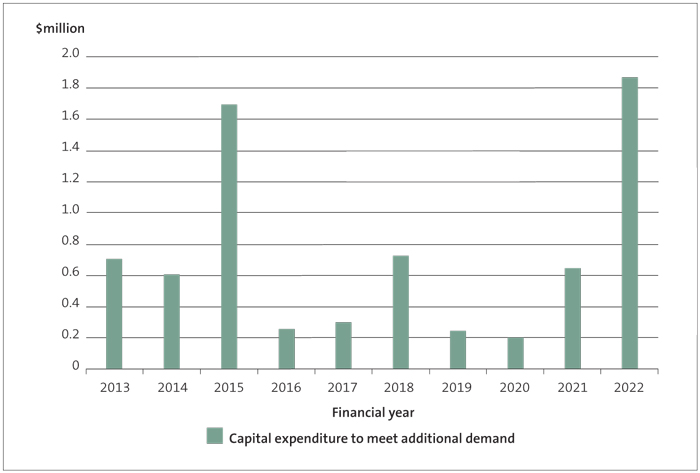
Timaru District Council has forecast that it will spend $7.2 million on capital expenditure to meet additional demand during the next 10 years. The Council has forecast to collect $200,000 of financial contributions in total for that period. However, because of the scale on the graph, we have not shown the forecast $20,000 revenue each year in Figure 9. Figure 9 reflects the forecast capital expenditure to meet additional demand only.
Figure 9
Timaru District Council’s forecast capital expenditure to meet additional demand, 2012/13 to 2021/22
2.44
The Council has a financial contributions policy, under which financial contributions would be used to offset or mitigate any adverse effects on the natural and physical environment, including utilities, services, or a new development.
2.45
The Council considered adopting a development contributions policy when it was preparing its draft 2012-22 long-term plan. However, it decided not to proceed with this because of the Government’s pending review of development contributions. The Council told us that it will consider adopting a development contributions policy with a view to amending the 2012-22 long-term plan after the Government’s review.
How Timaru District Council sets its growth charges
2.46
Under the Council’s financial contributions policy, it applies charges for water supply, wastewater, stormwater, and open space and recreation.
2.47
The Council differentiates growth charges based on boundaries, and urban or rural or industrial development.
9: The funding impact statement shows the forecast amount of funds to be raised from each source of funding, and how those funds will be applied.
10: Timaru District Council chose not to provide us with a typical growth charge for this discussion paper.
11: Plus a reserves and community infrastructure financial contribution charge, where applicable.
12: The Council states in its development contribution policy that connection fees will continue to apply in addition to the requirements to pay development contributions, except where a development contribution for water supply in the Coastal Tasman Area was paid prior to 1 July 2009, in which case the development contribution included a component for a connection fee.
13: The Producers Price Index reflects the change in the general level of prices for the productivity sector of New Zealand.
14: Tauranga City Council, Development Contributions Policy, page 6.

