Part 2: Our output classes, performance measures, and targets (including Statement of service performance)
Introduction
Achievement of our work programme
In our Annual Plan 2011/12, our work programme was set out in four main parts. Our achievements in three of those parts (annual audits; performance audits, inquiries, and other studies; and our contribution to the international auditing community and development of accounting and auditing standards) are set out in the output class performance information that follows on pages 24–58 .
The fourth part was work we undertook in response to the challenge to the public sector of delivering effective and efficient public services in a fiscally constrained environment, and was carried out across our output classes as shown in Figure 11.
Figure 11
Our work contributing to effective and efficient public service delivery
| We carried out work to | The work we did |
|---|---|
| Raise awareness of risks that can arise from change and how to manage them |
|
| Encourage better use of information to support good decision-making |
|
| Provide insight into local government |
|
| Provide good analysis and reporting of information about the transport sector |
|
Our published reports can be found on our website: www.oag.govt.nz. A list of the major reports completed during the year is included in Appendix 3.
Output class: Audit and assurance services
The main purpose of an annual audit is to provide independent assurance about the fair disclosure of the financial information – and, in many instances, performance information – within annual reports. We also use our annual audits to gather information and knowledge about public entities to assist us in advising Parliament and other stakeholders, and to help determine our other work.
Public entities responding to their statutory public reporting obligations and to findings resulting from audits is fundamental to trust in the public sector. The approach of public entities to public reporting and their responses to audit recommendations help demonstrate their commitment to effective, efficient, and accountable service delivery.
In 2011/12, annual audits and other assurance services accounted for 88% of our total expenditure. The major portion of this output class relates to annual audits of public entities that are required by statute to be carried out.
Key processes supporting annual audits
Appointing auditors and monitoring audit fees
The Auditor-General appoints auditors to carry out the annual audits of public entities. These auditors are appointed from a group that includes Audit New Zealand and private sector accounting firms. Most audits are allocated directly to an auditor, but from time to time an auditor is appointed to carry out an audit after a competitive tender.
We monitor audit fees to ensure that fees are fair to the public entities and also provide a fair return to the auditors for the work required by them to meet the Auditor-General's auditing standards.
During 2011/12, the Auditor-General appointed or reappointed auditors (except where a change of auditor was made within the same audit service provider) to conduct audits of 26 schools and 436 other public entities and their subsidiaries.
Setting the Auditor-General's auditing standards
Section 23 of the Public Audit Act 2001 requires the auditing standards of the Auditor-General to be published, by way of a report to the House of Representatives, "at least once every 3 years". The Auditor-General's Auditing Standards were most recently published in March 2011. These standards are available on our website (www.oag.govt.nz).
No significant changes were made to the standards during 2011/12. We plan to amend the standards in 2012/13 to align them with the External Reporting Board standards. Responsibility for setting assurance standards transferred from the New Zealand Institute of Chartered Accountants to the External Reporting Board on 1 July 2011. We do not expect this alignment will result in any significant changes to the Auditor-General's auditing standards.
Maintaining auditor independence
High independence standards are set for both the Auditor-General's employees and appointed auditors from private sector accounting firms. Compliance is monitored regularly, and any threats to auditor independence identified during the year were subject to mitigation actions that the Auditor-General considered appropriate to either eliminate the threats or reduce them to an acceptable level.
Quality assurance
We carry out quality assurance reviews of appointed auditors to ensure that they have complied with the Auditor-General's auditing standards. We aim to review the performance of each of our appointed auditors at least once every three years. There are five levels of quality assurance rating: "excellent", "very good", "good", "satisfactory", and "re-review".
We also carry out reviews of each firm's quality control systems that are designed to provide assurance about the organisational factors that affect audit quality. We aim to complete these reviews at least once every three years in conjunction with our quality assurance reviews of appointed auditors.
Our performance in 2011/12
We are generally pleased with results for the impact of our annual audits and other audits and assurance services this year. We note:
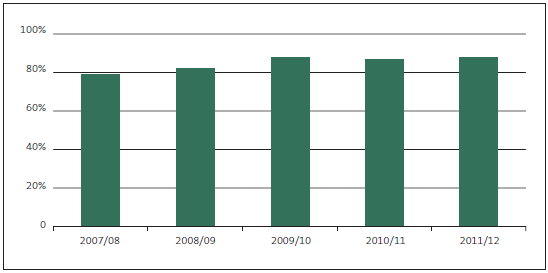
- a high percentage (88%) of audited financial statements being completed within statutory deadlines despite the disruption caused by the earthquakes, to both public entities and auditors alike;
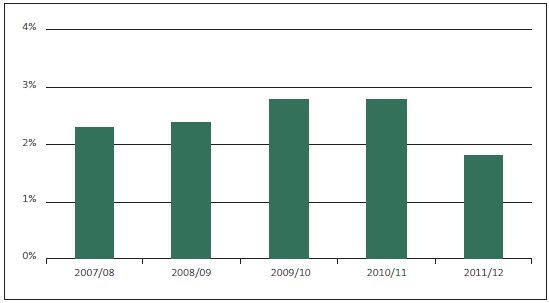
- a low percentage (1.8%) of modified audit opinions being maintained;
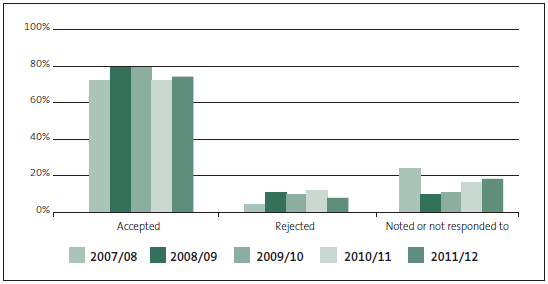
- a high percentage (74%) of acceptance by public entities of our recommendations for improvement being maintained, with a small increase compared with the previous year (72%); and
- a high percentage of "good" or "very good" grades assigned to public entities' systems and controls being maintained for management control environment (93%) and financial information (94%), and an improving percentage for service performance information systems and controls (53% compared with 32% in the previous year).
The results for carrying out annual audits and other audits and assurance services show a less positive picture. We note:
- an increase in the number of audits in arrears (from 319 at 30 June 2011 to 348 at 30 June 2012), reflecting the 2011/12 year in which the audits of all local authorities' LTPs were carried out, creating resourcing pressures particularly for Audit New Zealand;
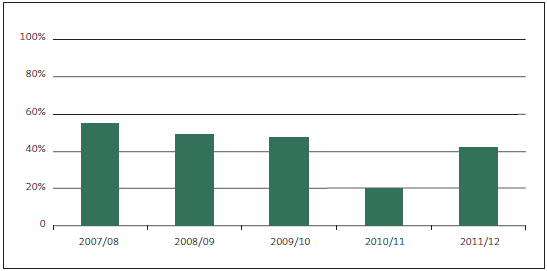
- a significant increase in the percentage of audit arrears being due to inaction on our part (42% compared with 20% in 2010/11), reflecting the resourcing issues noted above;
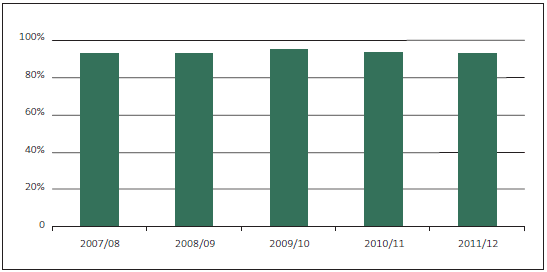
- a slight reduction in the timeliness of issuing management reports to public entities (93% compared with 94% in 2010/11) following the completion of our audits, against an ambitious target of 100%;
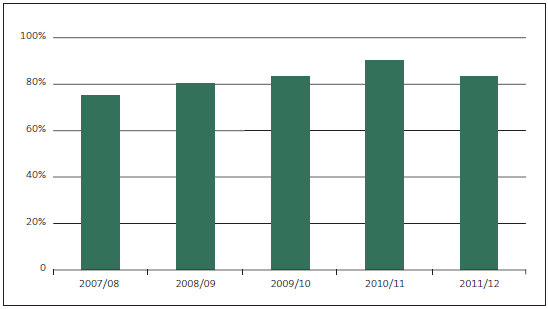
- a reduction in the level of client satisfaction as expressed by a sample of public entities, following a record high in 2010/11; the overall level of client satisfaction (83%) maintains a generally positive long-term trend;
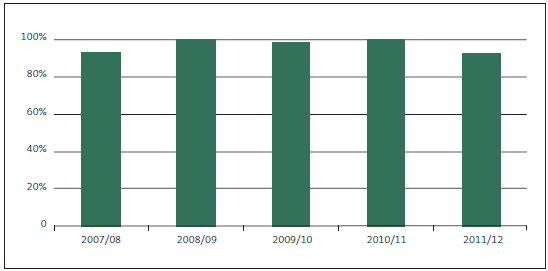
- a reduction in the percentage of appointed auditors receiving a quality assurance grade of "satisfactory" or better (92% compared with 100% in 2010/11); and
- confirmation from an independent review that our processes for auditor appointments and audit fee monitoring have been carried out with due probity and objectivity.
2011/12 key developments
During 2011/12, we continued:
- Supporting the change in standard-setting responsibility and approach of the new suite of public benefit entity accounting standards developed by the External Reporting Board (XRB);
- Supporting the work in phasing in the Auditor-General's revised auditing standard on reporting service performance information; and
- Our work on auditor regulation, now that all auditors of issuers are subject to regulation by the Financial Markets Authority (FMA). To protect the independence of the Auditor-General, audits of issuers carried out under the Public Audit Act 2001 are not subject to the new regulations. However, the Auditor-General intends to implement processes that are equivalent to (or as satisfactory as) the new regulations, including inviting the FMA to carry out quality reviews of issuer audits carried out on behalf of the Auditor-General.
Independent review of audit allocation and fee setting and monitoring
- Our independent reviewer concluded that the processes by which we allocate audits in the public sector and set fees in the financial year to 30 June 2012 were carried out with due probity and objectivity. The full report is set out in Appendix 2.
- We completed a comprehensive review of audit allocation among the Auditor-General's audit service providers, including Audit New Zealand. Some audits have been reallocated among audit service providers during 2011/12, and further changes will be made as necessary to maintain alignment with the allocation model's key principles.
Audit fees
- Fees were again affected by entity-specific issues in 2011/12. Some pressure on average charge-out rates resulted from auditors using a more senior team mix coupled with the return of some salary-driven pressure in the market for accountants and auditors.
- Figure 12 summarises the movements in audit fees from 2009/10 to 2011/12 based on the agreed audit fees at the time. It shows fee movement by sector and the effect of movements in audit hours and average hourly cost of carrying out audits.
Figure 12
Analysis of movements in audit fees
| 2009/10 to 2010/11 | 2010/11 to 2011/12 | |||||||
|---|---|---|---|---|---|---|---|---|
| Number of entities | Increase in total fee | Due to hours | Due to charge-out rate | Number of entities | Increase in total fee | Due to hours | Due to charge-out rate | |
| Central government | 350 | 4.2% | 2.7% | 1.5% | 367 | 3.7% | 2.4% | 1.3% |
| Local government | 370 | 3.2% | 1.6% | 1.6% | 379 | 1.0% | 0.2% | 0.8% |
| Schools | 2438 | 4.2% | 1.0% | 3.2% | 2447 | 4.1% | 0.6% | 3.5% |
| Total | 3158 | 3.9% | 2.0% | 1.9% | 3193 | 2.9% | 1.4% | 1.5% |

Figure 13
Summary of impacts and outputs for Audit and assurance services
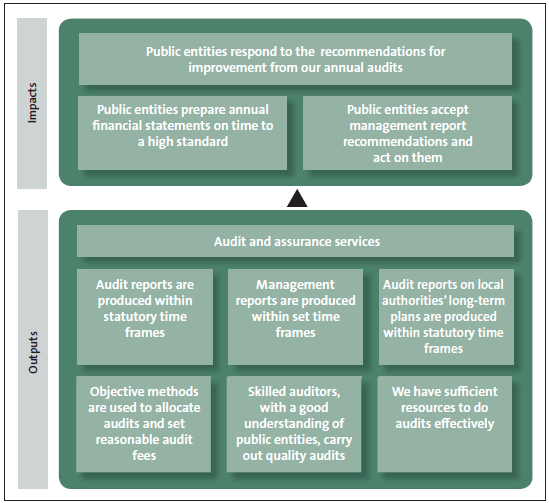
Impact: Public entities respond to the recommendations for improvement from our annual audits
| Measure: | Central government entities' management control environment (MCE), financial information systems and controls (FISC), and service performance information and associated systems and controls (SPIASC) are improved (or at least maintained), measured against the previous two years. |
| Comment: | We aim to contribute to improved financial and service performance reporting and improved performance management in public entities. We report our observations to entities on their MCE, FISC, and SPIASC, and assign grades accordingly: Very good, Good, Needs improvement, or Poor. Movements in the grades provide an indication of whether entities are accepting and responding to our recommendations, and improving their performance. 2011/12 results will not be available until November 2012. |
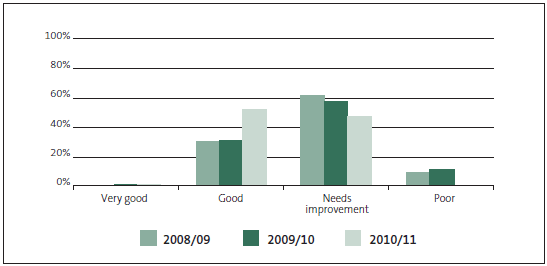
| Result: | Achieved. MCE, FISC, and SPIASC results (2010/11) show that, overall, these grades showed slight improvement measured against the previous two years. |
Figure 14
Grades for management control environment (MCE), 2008/09, 2009/10, and 2010/11
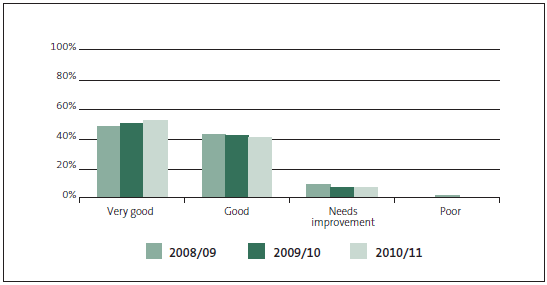
Figure 15
Grades for financial information systems and controls (FISC), 2008/09, 2009/10, and 2010/11
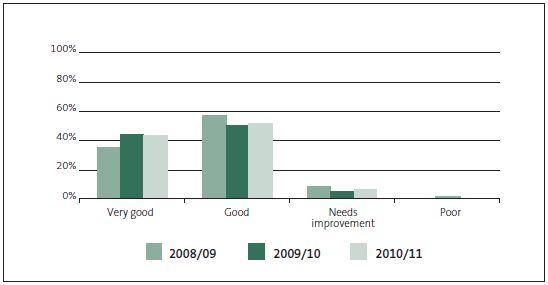
Figure 16
Grades for service performance information and associated systems and controls (SPIASC), 2008/09, 2009/10, and 2010/11
Impact: Public entities prepare annual financial statements on time to a high standard
| Measure: | The percentage of public entities' audited financial reports containing modified audit opinions is reduced (or at least maintained), measured against the previous two years. |
| Result: | Achieved. The percentage of public entities' audited financial reports containing modified audit opinions was reduced measured against the previous two years with an actual result of 1.8%. |
Figure 17
Percentage of audited financial reports that contain modified audit opinions
Impact: Public entities accept management report recommendations and act on them
| Measure: | Public entities' acceptance of audit service providers' management report recommendations is improved (or at least maintained), measured against the previous two years. |
| Comment: | For the year ended 30 June 2012, a sample of 40 entities with audit fees greater than $50,000 were assessed against this performance measure. Before 2011, this was only assessed against a sample of Audit New Zealand's management report recommendations. |
| Result: | Partially achieved. The percentage of management report recommendations accepted by public entities was improved measured against the previous year's results. Actual results: Accepted 74%, Rejected 8%, Noted or not responded to 18%. |
Figure 18
Percentage of management report recommendations accepted by public entities
Output: Audit reports are produced within statutory time frames
| Measure: | The percentage of public entities' audited financial reports issued within the statutory time frame is improved (or at least maintained), measured against the previous two years. |
| Result: | Achieved. The percentage of public entities' audited financial reports issued within the statutory time frame was maintained with an actual result of 88%. |
Figure 19
Percentage of audited financial reports issued on time
| Measure: | Less than 30% of the outstanding audit reports at 30 June are because of inaction on our part. |
| Result: | Not achieved. The percentage of outstanding audit reports at 30 June because of inaction on our part was 42%. |
| Comment: | Total arrears at 30 June 2012: 348, compared with 319 at 30 June 2011. |
Figure 20
Percentage of outstanding audit reports at 30 June because of our inaction
Output: Management reports are produced within set time frames
| Measure: | All management reports are issued within six weeks of issuing the audit report. |
| Result: | Not achieved. 93% of management reports were issued within six weeks of issuing the audit report. |
Figure 21
Percentage of management reports issued within six weeks
Output: Audit reports on local authorities' long-term plans are produced within statutory time frames
| Measure: | No outstanding long-term plan (LTP) audit opinions at 30 June of the year in which LTPs are to be adopted by local authorities are because of inaction on our part. |
| Result: | Achieved. No outstanding LTP audit opinions at 30 June because of inaction on our part. |
| Comment: | LTP audits are carried out on a three-yearly basis, and this year we report on our involvement in the 2012-22 LTP audits. |
For the 2012-22 LTPs, 94% of local authorities adopted their final LTP within the statutory deadline. Christchurch City Council obtained a one-year extension of time because of the Canterbury earthquakes, and, of the remaining four local authorities that completed their responsibilities after 30 June, all have now adopted their final LTPs. The work was intensive, particularly from February to June 2012. It dominated the workload of our audit service providers, and was a factor in some deteriorating performance in our annual audit commitments during that period.
| Measure: | All LTP management reports are issued within six weeks of issuing the LTP audit opinion. |
| Result: | Not achieved. 82% of management reports were issued within six weeks of issuing the LTP audit opinion. |
Output: Objective methods are used to allocate audits and set reasonable audit fees
| Measure: | An annual independent review of our processes confirms the probity and objectivity of the methods and systems we use to allocate and tender audits, and monitor the reasonableness of audit fees. |
| Result: | Achieved. The 2011/12 review confirmed that we achieved this measure. See Appendix 2. |
Output: Skilled auditors, with a good understanding of public entities, carry out quality audits
| Measure: | Client satisfaction survey results show that, overall, 75% of respondents are satisfied with the quality of audit work (including the expertise of staff and the quality of the public entity's relationship with their audit service provider). |
| Result: | Achieved. Overall, 83% of respondents were satisfied with the quality of audit work. |
Figure 22
Percentage of clients satisfied with the quality of audit work
| Measure: | Quality assurance reviews for all appointed auditors are completed during a three-year period. Of the auditors reviewed in any given year, 100% achieve a grade of "satisfactory" or better. |
| Comment: | This measure also appeared in the Organisational Health and Capability section of our Annual Plan 2011/12. It was removed from that section to avoid unnecessary duplication of results. |
| Result: | Not achieved. 92% of auditors achieved a grade of "satisfactory" or better. |
Figure 23
Percentage of auditors achieving a grade of satisfactory or better from quality assurance reviews
Output: We have sufficient resources to do audits effectively
| Measure: | The Officers of Parliament Committee accepts any significant proposals for an appropriation increase in audit fees and expenses. |
| Result: | No significant proposal was made in 2011/12 for an increase in appropriation for audit fees and expenses. |
Figure 24
Financial performance of output class: Audit and assurance services
| 2011/12 Actual $000 |
2011/12 Supp. Estimates $000 |
2010/11 Actual $000 |
2009/10 Actual $000 |
|
|---|---|---|---|---|
| Income | ||||
| Crown | 150 | 150 | 150 | 150 |
| Other | 71,644 | 70,485 | 65,194 | 63,939 |
| Expenditure | (70,729) | (70,635) | (65,043) | (62,736) |
| Surplus/(Deficit) | 1,065 | 0 | 301 | 1,353 |
Output class: Supporting accountability to Parliament
This output class includes two outputs:
- Services to Parliament – providing advice and assistance to select committees and other stakeholders; and
- Controller function – carrying out the Controller function.
Services to Parliament
We provide advice and assistance to Parliament through:
- reports and advice to select committees to assist their financial reviews of government departments and Offices of Parliament, State-owned enterprises, and some Crown entities;
- reports and advice to select committees to assist their examination of the Estimates of Appropriations;
- reports to responsible Ministers on the results of the annual audits; and
- reporting to Parliament and other stakeholders on matters arising from our annual audits.
Contributing to the international auditing community
In 2011/12, the OAG hosted a range of international delegations providing opportunities to exchange information and build networks internationally. We were pleased to assist colleagues from the State Audit Offices of India and Vietnam, the Board of Audit and Inspection of Korea, and the Australian National Audit Office, as well as visitors from the Malaysian Accountant General, the Chief Information Commissioner, India, and representatives from Ministries of the Republic of Korea.
We continued to support the promotion of transparent, accountable, effective and efficient use of public sector resources in the Pacific through our role as the current Secretary-General of the Pacific Association of Supreme Audit Institutions (PASAI), and the Auditor-General's representation of the PASAI region on the governing board of the International Organisation of Supreme Audit Institutions (INTOSAI). 2011/12 was the first year of our five-year funding agreement with the Ministry of Foreign Affairs and Trade, which has enabled our Office to provide significantly more support and expertise in the Pacific.
We are members of various committees of INTOSAI, including the Professional Standards Steering Committee. This year, we were involved in chairing two working groups tasked with developing guidance for supreme audit institutions. One of these working groups is developing a new INTOSAI standard on the value and benefits of Supreme Audits Institutions (SAIs) which sets out ways that SAIs can add value through carrying out their own work.
The Controller function
The Controller function of the Controller and Auditor-General provides independent assurance to Parliament that the expenses and capital expenditure of government departments and Offices of Parliament have been incurred for purposes that are lawful and within the scope, amount, and period of the appropriation or other authority.
The OAG and appointed auditors carry out standard procedures to give effect to the Controller function in keeping with the Auditor-General's auditing standards and a Memorandum of Understanding with the Treasury. This involves reviewing monthly reports provided by the Treasury, and advising the Treasury of any issues arising and the action to be taken.
Each year, we report to Parliament on the significant issues arising from the operation of the Controller function.
Our performance in 2011/12
Our results for this output class show that our work continues to play an important part in supporting accountability to Parliament. This is pleasing, given the continuing high demand for advice to select committees: in 2011/12 we provided advice in support of 95 financial reviews and 47 Estimates examinations (90 and 53 in 2010/11).
Our stakeholder feedback confirms that the Office is continuing to perform at a high level, with stakeholders valuing the professional and impartial advice and guidance that they receive from us. Our feedback from select committee chairs indicates that the sector knowledge and relationship management skills of our staff are highly valued.
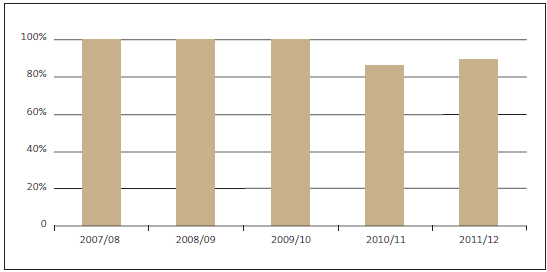
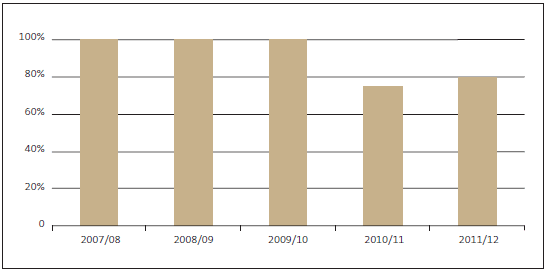
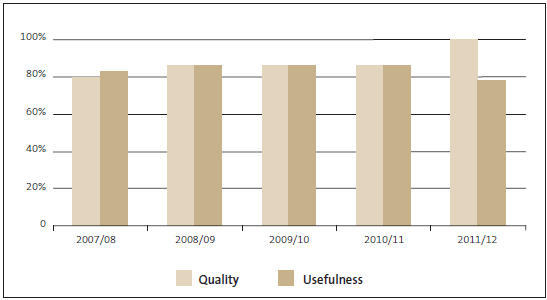
Select committee members continue to value the quality and usefulness of our advice – 89% of members surveyed agree that the Office's advice assists in their Estimates of Appropriation and financial review examinations, up from 86% in the previous year. The percentage of members who rate the quality of our advice as 4 or better on a scale of 1 to 5 has increased from 86% to 100%. The percentage of members who rate the usefulness of that advice against the same scale has decreased from 86% to 78%. We saw an increase in the rating of other stakeholders for the relevance and usefulness of our advice on a scale of 1 to 5 from 75% to 80%.The small number of stakeholders we survey does lead to significant shifts in percentage terms from year to year.
Our stakeholders told us that they would like us to engage more systematically with them, and to provide more information about the Office's broader and longer-term plan of work, including our expectations and priorities. This feedback aligns with our work on developing a more strategic approach to our work programme planning. We are continuing with initiatives to take more of a sector approach to our work and reporting, and we will produce new sector-specific reports in 2012/13.

Figure 25
Summary of impact and outputs for Supporting accountability to Parliament
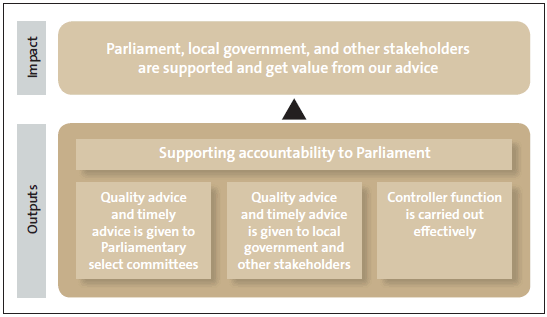
Impact: Parliament, local government, and other stakeholders are supported and get value from our advice
| Measure: | At least 85% of select committee members confirm that our advice assists them in Estimates of Appropriation and financial review examinations. |
| Result: | Achieved. 89% of select committee members confirmed that our advice assists them in Estimates of Appropriation and financial review examinations. |
Figure 26
Percentage of select committee members who confirmed that our advice assists them in Estimates of Appropriations and financial review examinations
| Measure: | At least 85% of other stakeholders we survey rate the advice they receive from us as 4 or better on a scale of 1 to 5 for relevance and usefulness. |
| Result: | Not achieved. 80% of other stakeholders we survey rate the advice they receive from us as 4 or better on a scale of 1 to 5 for relevance and usefulness. |
Figure 27
Percentage of other stakeholders who rated our advice as 4 or better on a scale of 1 to 5 for relevance and usefulness
Output: Quality advice and timely advice is given to Parliamentary select committees, local government and other stakeholders
| Measure: | At least 85% of select committee members we survey rate the advice they receive from us as 4 or better on a scale of 1 to 5 for quality and usefulness. |
| Result: | Partially achieved. 100% of select committee members rated the advice they receive from us as 4 or better for quality, and 78% rated the advice they receive from us as 4 or better for usefulness. |
Figure 28
Percentage of select committee members who rated our advice as 4 or better on a scale of 1 to 5 for quality and usefulness
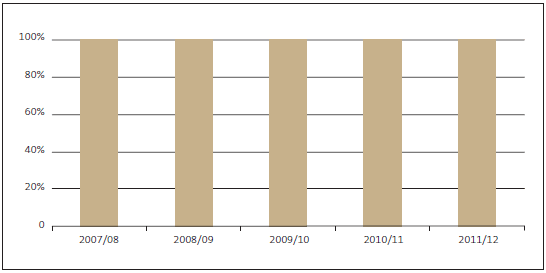
| Measure: | Reports and advice are given to select committees and Ministers at least two days before an examination, unless otherwise agreed. |
| Result: | Achieved. 100% of reports and advice were given to select committees and Ministers at least two days before examination. |
Figure 29
Percentage of reports and advice given to select committees and Ministers at least two days before an examination, unless otherwise agreed
| Measure: | An internal quality assurance review of a sample of financial review, Estimates of Appropriations, and Ministerial reports confirms that they meet relevant standards and procedures, including that reports are consistent in their framework and approach, and are peer-reviewed in draft. |
| Comment: | A review is carried out at least once every three years. The nature, extent, and frequency of those reviews are based on risk. |
| Result: | No review was considered necessary in 2011/12. A review carried out in 2010/11 confirmed that the appropriate systems were in place and operated effectively. |
Output: Controller function is carried out effectively
| Measure: | Internal quality assurance is carried out to gain assurance that our policies, procedures, and standards for the Controller function have been applied appropriately. |
| Comment: | A review is carried out at least once every three years. The nature, extent, and frequency of those reviews are based on risk. |
| Result: | Achieved. An internal quality assurance review in June 2012 confirmed that our policies, procedures, and standards for the Controller function were applied appropriately. |
| Measure: | Monthly statements provided by the Treasury are reviewed for the period September to June inclusive. Advice of issues arising and action to be taken is provided to the Treasury and appointed auditors within five working days of receipt of the statement. |
| Result: | Achieved. All monthly procedures were followed and agreed time frames achieved. |
Figure 30
Financial performance of output class: Supporting accountability to Parliament
| 2011/12 Actual $000 |
2011/12 Supp. Estimates $000 |
2010/11 Actual $000 |
2009/10 Actual $000 |
|
|---|---|---|---|---|
| Income | ||||
| Crown | 2,760 | 2,760 | 2,460 | 2,460 |
| Other | 174 | 245 | 0 | 0 |
| Expenditure | (3,047) | (3,005) | (2,442) | (2,342) |
| Surplus/(Deficit) | (113) | 0 | 18 | 118 |
Output class: Performance audits and inquiries
The Public Audit Act 2001 allows the Auditor-General to carry out performance audits and to inquire into a public entity's use of its resources. Our performance audit and inquiries work allows the Auditor-General to consider and provide advice about matters in greater depth than is possible within the statutory scope of an annual audit.
Performance audits are significant and in-depth audits covering issues of effectiveness and efficiency. The issues examined by performance audits are independently selected by the Auditor-General. We plan our work programme carefully, to provide Parliament with assurance about an appropriate range of specific issues or programmes, and how well these are managed by the relevant public entity or entities.
By contrast, our inquiries work largely reacts to issues of current public concern. We usually receive 200 to 300 requests for inquiries annually, spanning a wide range of concerns about central and local government entities. Most are dealt with through routine correspondence, but each year there are some that require significant work. If there is general public interest in an inquiry, we will usually publicly report the results. The Auditor-General also administers the Local Authorities (Members' Interests) Act 1968, which regulates pecuniary interest questions in the local government sector. Each year, we usually receive 50 to 100 requests under that Act.
We also do other studies that result in published reports and good practice guidance on topical issues of public sector accountability and performance.
Through our performance audits, inquiries, and other studies, we seek to identify good or emerging practices, raise any concerns, and recommend ways that a public entity can perform better, as appropriate. Our reports have benefits for the audited entities and for the wider public sector, and our work encourages:
- beneficial changes and good practice in the performance of public entities;
- development of better methods to evaluate aspects of public sector management; and
- increased understanding of an audited entity, of the wider environment in which public entities operate, and/or of public sector management.
Our performance in 2011/12
Reports on performance audits, other studies, and major inquiries
In 2011/12, we completed a range of reports on matters arising from performance audits, other studies, and major inquiries. These reports are listed in Appendix 3, and copies are available on our website (www.oag.govt.nz).
Our published reports encourage ongoing high performance and performance improvement across the public sector. They highlight complexities to be managed, factors underpinning good decision-making and success, and make recommendations for improvement, where appropriate.
Quality and usefulness of our reports
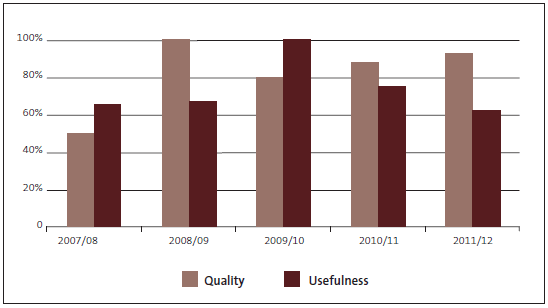
Each year, we seek the views of a small sample of select committee members and other stakeholders on the quality and usefulness of our published performance audit reports. This year we are pleased that 93% of stakeholders surveyed highly rated the quality of our performance audits, with our target being 85%. We were disappointed that the proportion of stakeholders highly rating the usefulness of performance audit reports has dropped in the last two years, falling to 62% this year, well below our 85% target. In 2012/13, our intention is to better understand the decrease in usefulness rating, and to consistently meet or exceed our 85% target for quality and usefulness in the future.
Each year, two of our performance audit reports are independently reviewed. Reviewers rate the reports on a scale from 1 (low quality) to 5 (top quality) against a set of review criteria, and also give an overall rating. Our reports were rated highly for quality (just less than 4), and common strengths such as strong overviews putting across key messages, and well-formulated, appropriate, and realistic recommendations were noted. Our 2012 report ratings are however slightly lower than for previous years' reports, and we are committed to improving the quality of our reports by addressing the improvement areas identified.
Progress in acting on our recommendations
We regularly report on the progress public entities have made in acting on our performance audit reports' recommendations. Our May 2012 report on Public entities' progress in implementing the Auditor-General's recommendations 2012 showed that good progress had been made in implementing most recommendations. Slow progress in some areas reflected changes in policy direction, unforeseen difficulties in implementing new technology or lack of co-ordination, planning and information sharing between agencies.
We were also pleased that public entities not directly involved in our audits had used the reports' lessons and recommendations. Many city and district councils, for example, were using our audit framework to assess and strengthen how they forecast demand for drinking water.
Our inquiries' work has contributed to positive change, helping people understand what public entities are doing by providing an independent and detailed description of what has happened, assurance over the proper use of public resources, and highlighting areas where change is needed. We were very pleased, for example, that many concerns raised in our report, How the Department of Internal Affairs manages spending that could give personal benefit to Ministers (December 2010), were addressed in the development of the Members of Parliament (Remuneration and Services) Bill, introduced in October 2011. We have also monitored the Department's implementation of significant administrative improvements.
Progress with completion of our 2011/12 Annual Plan
Figure 31 lists work from our 2011/12 Annual Plan that has been completed since 30 June 2012, or will be completed in 2012/13.
Figure 31 lists work from our 2011/12 Annual Plan that has been completed since 30 June 2012, or will be completed in 2012/13.
Figure 31
Work in progress from our 2011/12 Annual Plan
| 1 | Response of the New Zealand Police to the Commission of Inquiry into Police Conduct: Third monitoring report (to be presented to the House of Representatives in October 2012) |
| 2 | Road safety: Enforcement efforts to reduce drink-driving |
| 3 | Effectiveness of arrangements to check the standard of rest homes services: Follow-up report (presented to the House of Representatives on 18 September 2012) |
| 4 | Biosecurity: Preparedness for, and response to, incursions from unwanted organisms |
| 5 | Protecting and maintaining our biodiversity and natural ecosystems |
| 6 | Education for Māori: Context for our proposed audit work until 2017 (presented to the House of Representatives on 14 August 2012) |
| 7 | Further work to meet the statutory requirement that the Auditor-General review the service performance of Auckland Council and its council controlled organisations. |
Work deferred from our 2011/12 Annual Plan, including an audit of a specific defence acquisition project and/or an audit of the defence acquisition process, and School Governance: How well school boards of trustees plan and review for student achievement, will be considered as potential topics for future work programmes.
The relevance and usefulness of our work programme
Our 2012/13 work programme is focused on the question: Our future needs – is the public sector ready? We chose this theme as a result of extensive consultation carried out in 2011/12. We consulted with Parliament and other stakeholders, receiving support for our theme and helpful advice that assisted us to clarify the scope of some of our proposed specific performance audits and other studies.
Inquiries
During 2011/12 we received 227 new requests for inquiries and 54 requests on Local Authorities (Members' Interests) Act matters. We had carried forward a total of 17 requests from the previous year, and ended this year carrying forward 33 requests. In terms of workflow, we usually have about 20 inquiry matters open at any point in time.
Figure 32
Number and type of inquiries completed
| Inquiry type | 2011/12 | 2010/11 | 2009/10 | 2008/09 | 2007/08 |
|---|---|---|---|---|---|
| Major | 2 | 3 | 5 | 2 | 0 |
| Significant | 4 | 10 | 16 | 11 | 11 |
| Routine | 204 | 144 | 182 | 99 | 115 |
| No inquiry | 2 | 41 | 66 | 142 | 116 |
| LAMIA* | 54 | 91 | 80 | 53 | 110 |
| Total | 266 | 289 | 349 | 307 | 354 |
* Local Authorities (Members' Interests) Act 1968.
Our inquiries function enables us to react to issues of current public concern, and is inevitably reactive. In publishing terms, 2011/12 appeared relatively quiet. We did not produce any inquiry reports that warranted tabling in Parliament and published only two inquiry reports on our website:
- Inquiry into the use of parliamentary travel entitlements by Mr and Mrs Wong (September 2011); and
- Inquiry into how Christchurch City Council managed conflicts of interest when it made decisions about insurance cover (April 2012).
However, the year was still busy. We dealt with a large number of routine matters that required careful work, and we also had several significant matters "open" in our system for an extended period of time while we monitored steps that were being taken elsewhere on the various issues.
The last few months of 2011/12 were marked by a large number of high profile requests to inquire into matters of public concern. By the end of the year we had announced four new major inquiries, and we were close to completing one other major inquiry. We were also considering an unusually high number of requests on other matters of significant public interest. The level of public interest in our inquiry work is prompting us to review how we interact with the media on matters of current public interest.
Matters resulting in "no inquiry" have dropped to two this year. This change shows the results of the work carried out in the last year to provide better public information on our inquiries work, to help people understand what issues we can and cannot look at, and to improve our basic processes for receiving and managing requests efficiently. We now have more effective systems for ensuring that we focus our effort on matters that are appropriate.
The Local Authorities (Members' Interests) Act 1968
We responded to requests on 54 matters relating to this Act in 2011/12. No particular issues warrant comment this year. We provided a comprehensive submission to the Department of Internal Affairs in response to its discussion paper on options for reform of the Act, but the review does not appear to have progressed further.

Figure 33
Summary of impacts and outputs for Performance audits and inquiries
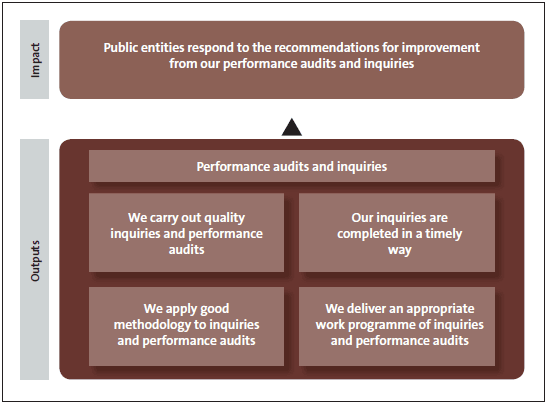
Impact: Public entities respond to the recommendations for improvement from our performance audits and inquiries
| Measure: | Entities accept or respond to the recommendations made in the reports on our performance audits. |
| Comment: | Each year, we review how entities have responded to a selection of our reports and present the results to Parliament in our annual follow-up report. |
| Result: | Achieved. In May 2012, we reported to Parliament on how well public entities had acted on the recommendations that we made in six performance audit reports published in 2009 and 2010. Our report Public entities' progress in implementing the Auditor-General's recommendations 2012 showed good progress had been made in implementing most recommendations. |
| Measure: | Entities take action in response to concerns identified in inquiry reports, as assessed by follow-up on a sample of sensitive and major inquiries carried out in the previous year. |
| Results: | Achieved. In 2011/12, we followed up on three major inquiry reports. In two cases, our recommendations provided the basis for major change programmes that have progressed well over the last year. In one case, our recommendations were accepted in principle and the issues were incorporated into broader work on organisational change. In 2010/11, we followed up on three inquiries. In all cases, the entities accepted our comments and took action to address the concerns. |
Output: We carry out quality inquiries and performance audits
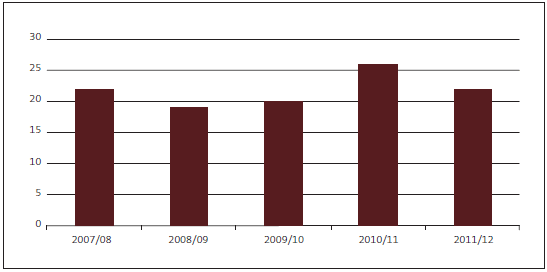
| Measure: | We complete 19 to 21 reports on matters arising from performance audits and other studies, and inquiries. |
| Result: | Achieved. We completed 22 reports on matters arising from performance audits and other studies, and inquiries (see Appendix 3). |
Figure 34
Completed reports on matters arising from performance audits and other studies, and inquiries
| Measure: | Independent reviews of two performance audit reports confirm the quality of our reports. |
| Results: | Achieved. Overall review results confirmed the quality of reports and provided feedback on areas for improvement. |
| Measure: | At least 85% of the stakeholders that we seek feedback from rate our performance audit reports (relevant to their sector or interest) as 4 or better on a scale of 1 to 5 for quality and usefulness. |
| Result: | Partially achieved. 93% of our stakeholders rated our performance audit reports as 4 or better for quality. 62% rated our performance audit reports as 4 or better for usefulness. |
Figure 35
Percentage of select committee, local government, and other stakeholders who rated on a scale of 1 to 5 the quality and usefulness of our performance audit reports as 4 or better
Output: Our inquiries are completed in a timely way
| Measure: | 80% of our findings on inquiries are reported to the relevant parties within three months for routine inquiries, six months for significant inquiries and 12 months for major inquiries. |
| Result: | Partially achieved. 96% of findings reported within three months for routine inquiries, 50% of findings reported within six months for significant inquiries, and 100% of findings reported within 12 months for major inquiries. |
Figure 36
Percentage of findings on routine inquiries reported to the relevant parties within three months
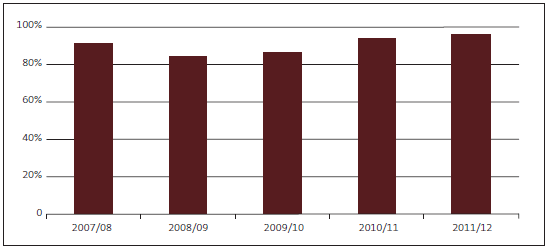
Figure 37
Percentage of findings on significant inquiries reported to the relevant parties within six months
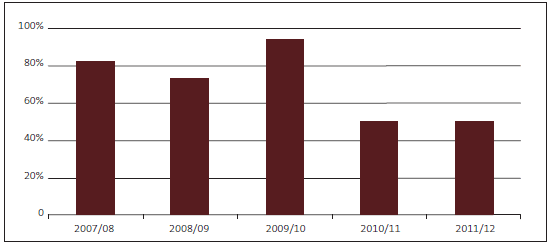
Figure 38
Number of findings on major inquiries reported to the relevant parties within 12 months
| Year | Completed major inquiries | Reported within 12 months |
|---|---|---|
| 2012 | 1 | 1 |
| 2011 | 3 | 1 |
| 2010 | 5 | 4 |
| 2009 | 2 | Both reported within 13 months |
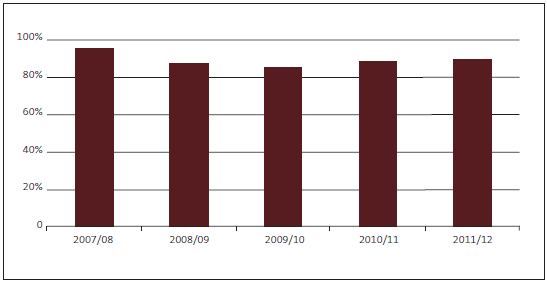
| Measure: | We complete 80% of enquiries under the Local Authorities (Members' Interests) Act 1968 within 30 working days. |
| Result: | Achieved. 89% of LAMIA enquiries completed within 30 working days (48 out of total of 54). |
Figure 39
Percentage of enquiries under the Local Authorities (Members' Interests) Act 1968 completed within 30 working days
Output: We apply good methodology to inquiries and performance audits
| Measure: | Our performance audit methodology reflects good practice for carrying out such audits, as assessed every second year by the Australian National Audit Office. |
| Results: |
The next Australian National Audit Office peer review of our methodology and reports will be conducted in late 2012 or early 2013. There was no review in 2011/12. 2008/09 – The ANAO reviewed two performance audits and confirmed areas in which the quality of our reports is strong and noted areas for us to improve. |
| Measure: | Internal quality assurance reviews on selected performance audit reports confirm that reports are prepared in keeping with the performance audit methodology. |
| Comment: | A review is carried out at least once every three years. The nature, extent, and frequency of the reviews are based on risk. |
| Results: | No review was considered necessary in 2011/12. A 2010/11 internal review confirmed that appropriate systems and controls are in place and that reports are prepared in keeping with the performance audit methodology. |
| Measure: | Responses to requests for inquiries and our administering of the Local Authorities (Members' Interests) Act 1968 requests are in keeping with relevant policies, procedures, and standards, as confirmed by internal quality assurance review. |
| Comment: | A review is carried out at least once every three years. The nature, extent, and frequency of the reviews are based on risk. |
| Results: |
No internal quality assurance review was considered necessary in 2011/12. 2010/11 – Reviews were completed for both the general inquiries and LAMIA enquiries systems, and confirmed that responses to requests were provided in keeping with relevant policies, procedures, and standards. |
Output: We deliver an appropriate work programme of performance audits
| Measure: | Select committees and other stakeholders are satisfied with the proposed work programme of performance audits (as indicated by feedback on our draft annual work programme.) |
| Results: |
Achieved. 2012 – Feedback received from select committees and other stakeholders mainly supported our proposed work programme, and enabled us to clarify the proposed scope of some specific pieces of work. 2007 to 2010 – Feedback received from select committees and other stakeholders mainly supported our proposals and approach. |
Figure 40
Financial performance of output class: Performance audits and inquiries
| 2011/12 Actual $000 |
2011/12 Supp. Estimates $000 |
2010/11 Actual $000 |
2009/10 Actual $000 |
|
|---|---|---|---|---|
| Income | ||||
| Crown | 6,287 | 6,287 | 6,587 | 6,587 |
| Other | 0 | 0 | 0 | 0 |
| Expenditure | (5,790) | (6,287) | (5,991) | (6,044) |
| Surplus/(Deficit) | 497 | 0 | 596 | 543 |

