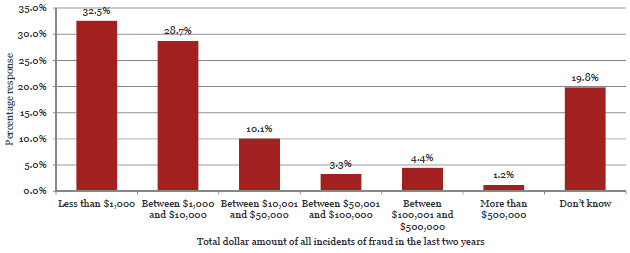
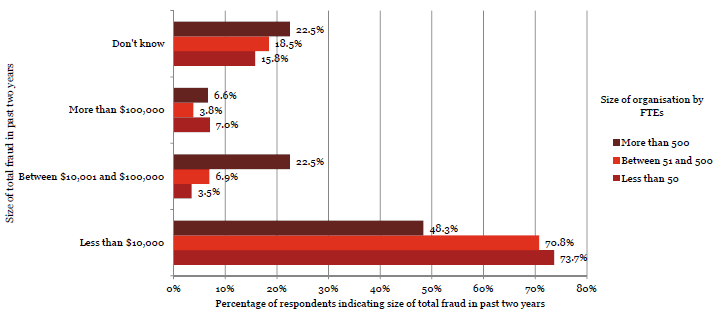
33. What is the total dollar amount of all incidents of fraud and corruption that you are aware have occurred at your organisation within the last two years?
Public Sector Fraud Awareness Survey - Findings: Incidents of fraud.
Observation:
PwC comment:
Most respondents reported that the amount lost to fraud was relatively low. The proceeds of fraud are often accrued in small amounts over long periods. It is not always possible to establish the actual amount of a fraud because records are incomplete, or because of incomplete investigations.
Of the 22.5% of respondents who were aware of at least one incident of fraud in their organisation, 61.2% indicated the total value of fraud committed was less than $10,000. The breakdown was 64% for Local Government, 54% for Central Government organisations and 90% for Schools.

| Less than $10,000 | $10,001 - $100,000 | More than $100,000 | Don’t know | Total | |||||
|---|---|---|---|---|---|---|---|---|---|
| Central Government | |||||||||
| Autonomous Crown Entities | 7 | 70% | 2 | 20% | 0 | 0% | 1 | 10% | 10 |
| Central Government - Other | 6 | 60% | 3 | 30% | 0 | 0% | 1 | 10% | 10 |
| Crown Agents or Companies | 9 | 36% | 2 | 8% | 7 | 28% | 7 | 28% | 25 |
| Crown Research Institutes | 2 | 100% | 0 | 0% | 0 | 0% | 0 | 0% | 2 |
| District Health Boards | 14 | 56% | 2 | 8% | 3 | 12% | 6 | 24% | 25 |
| Government Departments | 26 | 45% | 12 | 21% | 3 | 5% | 17 | 29% | 58 |
| Independent Crown Entities | 0 | 0% | 0 | 0% | 1 | 50% | 1 | 50% | 2 |
| Māori Trust Boards | 3 | 100% | 0 | 0% | 0 | 0% | 0 | 0% | 3 |
| Rural Education Activities Programmes | 3 | 100% | 0 | 0% | 0 | 0% | 0 | 0% | 3 |
| State-Owned Enterprises | 8 | 42% | 3 | 16% | 2 | 11% | 6 | 32% | 19 |
| Tertiary Education Institutions | 24 | 73% | 4 | 12% | 0 | 0% | 5 | 15% | 33 |
| Sub-Total | 102 | 54% | 28 | 15% | 16 | 8% | 44 | 23% | 190 |
| Less than $10,000 | $10,001 - $100,000 | More than $100,000 | Don’t know | Total | |||||
|---|---|---|---|---|---|---|---|---|---|
| Local Government | |||||||||
| Airports | 2 | 33% | 1 | 17% | 0 | 0% | 3 | 50% | 6 |
| Council Controlled Organisations or Council Controlled Trading Organisations | 11 | 79% | 0 | 0% | 1 | 7% | 2 | 14% | 14 |
| Energy Companies | 10 | 71% | 3 | 21% | 0 | 0% | 1 | 7% | 14 |
| Fish and Game Councils | 1 | 100% | 0 | 0% | 0 | 0% | 0 | 0% | 1 |
| Licensing and Community Trusts | 2 | 33% | 4 | 67% | 0 | 0% | 0 | 0% | 6 |
| Local Authorities | 43 | 64% | 9 | 13% | 1 | 1% | 14 | 21% | 67 |
| Local Government - Other | 0 | 0% | 0 | 0% | 0 | 0% | 0 | 0% | 0 |
| Port Companies | 0 | 0% | 0 | 0% | 0 | 0% | 0 | 0% | 0 |
| Sub-Total | 69 | 64% | 17 | 16% | 2 | 2% | 20 | 19% | 108 |
| Schools | 36 | 90% | 0 | 0% | 1 | 3% | 3 | 8% | 40 |
| Total | 207 | 61% | 45 | 13% | 19 | 6% | 67 | 20% | 338 |
Observation:
The majority of fraud losses across all entities are less than $10,000.
Of those organisations with more than 500 FTEs, 29.1% had losses due to fraud of over $10,000.


