Part 5: Analysing trends in performance
5.1
In Parts 3 and 4 of this paper, we discussed the need for entities to have measures that enable them to evaluate the efficiency and economy of their services and outputs, as well as the impact and outcomes (effectiveness) and cost-effectiveness of what they do.
5.2
In this Part, we look at the importance of thoroughly analysing annual report data, and the necessity of doing this over a long time to reveal and tell the performance story of an entity. A good performance story relies on appropriate performance measures, robust analytical and evaluation procedures to see what the data reveals, and communicating the responses and/or actions taken.
Reasons for measuring over a longer time
5.3
A common practice in annual reports is to report the current year's performance in detail and, often, to provide comparative year(s) information.
5.4
Some entities choose to provide data for only the year they are reporting on, while others provide historical information and include some trend analysis. This, understandably, has led entities to focus primarily, and sometimes exclusively, on the most recent financial year. However, entities can include results from previous years to provide a picture of performance over time.
5.5
There are two main drawbacks to a focus on a single year. First, the highest-level objective of most public services is positive change. This might be a change in behaviour, such as reduced criminal offending or increased payment of fines, less smuggling of undeclared prohibited goods and people across New Zealand's borders, or improving the survival rates for small businesses. But these are big, nationwide systems and behaviours that entities are endeavouring, every year, to improve. Such changes can take years.
5.6
The impact of outputs often cannot be seen by looking at one or two years, but must be examined over five or even 10 years to see what is really resulting from public sector endeavours.
5.7
Under current annual reporting practices, to see the longer term picture the reader has to look at five or more annual reports to try to compare the data, and carry out their own analysis to determine the trends. Manually sorting through multiple documents is a labour-intensive activity that is likely to deter public interest in the performance of an entity.
5.8
The second drawback to focusing on only one or two years of performance data is that it does not provide the entity with strong management information on which to base critical judgements about investment, operating models, or adjustments to strategies and actions. Again, too short a time span cannot reveal the trends of long-term change or the real effect of outputs.
Good management information should mean good performance reporting information
5.9
We see no significant difference between good management information and good performance reporting information. For most critical aspects of output delivery, data should be provided and analysed over longer periods – more than five years – to assess the impacts and outcomes as a result of an entity's outputs.
5.10
One issue entities face in analysing data over longer periods is the constancy of the measures and indicators they use. This is not necessarily problematic because entities should be adjusting their measures when making changes to their operating models, strategies, or outputs, or simply to improve the quality of their measures.
5.11
Changes become problematic when they are too frequent, and constrain the reader's and the entity's ability to make comparisons and analyse performance over time. Such changes have the potential to undermine clarity and accountability.
5.12
Entities could overcome this by introducing changes to measures over time, showing two sets of measures and associated data for a transitional period or collecting data on new measures until a comparative picture has emerged. However, an entity needs to assess whether any costs of doing this are justified by the benefits to be gained.
5.13
Once longer-term data is available, the next important step is to ensure that it is properly analysed into useful information about performance.
5.14
The main difference between data and information is whether the raw material has been analysed and interpreted. Data that has not been analysed and interpreted is unlikely to hold the same value for the reader seeking to understand an entity's performance.
5.15
Ideally, an annual report should provide a clear picture of how an entity is performing, in language and focus that is relevant to its readers. There is very little value in burdening a reader with pages of data rather than information.
5.16
The following examples show the value of looking at performance over a longer time, and of seeking to understand what the numbers reveal about performance.
Examples of measuring over a longer time
Ministry of Transport
5.17
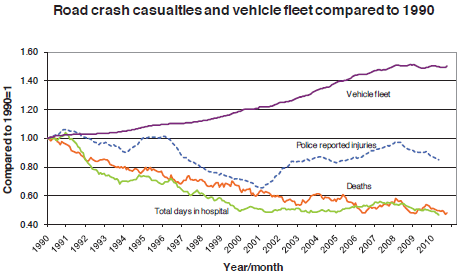
Figure 14 shows an example of long-term outcome data about road casualties and the size of the vehicle fleet. This is a good example of how looking at data over a longer time can reveal material changes and a successful system of public services.
5.18
Figure 14 is not featured in the annual report of the Ministry of Transport but is on its website.
Figure 14
Ministry of Transport – example of long-term outcome measurement (road crash casualties and the vehicle fleet)
5.19
If just one or two years of this data were available at a time, the reader would be able to see only that deaths in, say, 2010 were higher than in 2009 and injuries lower. It would not be possible to see the overall trend of declining deaths and days in hospital with the increasing size of the vehicle fleet.
New Zealand Fire Service
5.20
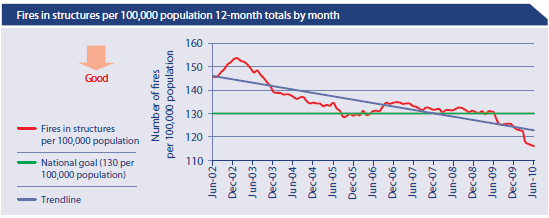
In its 2009/10 annual report, the Fire Service provides a series of reports on its performance against its long-term goals. For example, the Fire Service reports on the numbers of fires in structures for every 100,000 people in the population (see Figure 15).
Figure 15
New Zealand Fire Service – example of long-term trend information
Source: New Zealand Fire Service Commission, Annual Report 2009/10, page 20.
5.21
Figure 15 shows the trend over eight years of decreasing numbers of fires compared with the national goal. Including all eight years lets the reader see the period of relative stability in fire incidence and that a further downward trend began in 2010.
5.22
The Fire Service's annual report also provides similarly presented data on different types of fires, fatalities and injuries, property damage, and response times. Overall, this provides an excellent picture of "the business" of the Fire Service and its performance against its main goals.
5.23
Similar to the earlier example about road crash casualties, if the fire data showed just the current year and the previous year, a reader could determine only whether the performance was positive compared with the previous year. We would not be able to see the overall trend over time. The reader might also believe the incidence of fires to be quite high at between 110 and 130 each year because the reader would not see that the incidence of fires was more than 150 eight years ago. The incidence of fires could still be quite high even though there is a declining trend. Long-term term analysis and benchmarking with similar countries is very important to understanding the performance story and to making judgements about performance.
New Zealand Customs Service
5.24
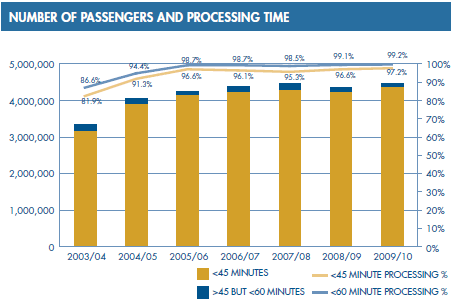
In its 2009/10 annual report, Customs provides data on the number of passengers and Customs' processing time over seven years – enough to gain an insight into how performance is changing (see Figure 16).
Figure 16
New Zealand Customs Service – trends in time taken to process passengers
Source: New Zealand Customs Service, Annual Report 2008/09, page 38.
5.25
Figure 16 shows the reader that the number and percentage of passengers processed within a 45-minute and 60-minute timeframe is increasing. This is a measure of service performance, not an impact or outcome, but is nevertheless more useful than the current year's performance data alone.
Example of analysing performance data
New Zealand Customs Service
5.26
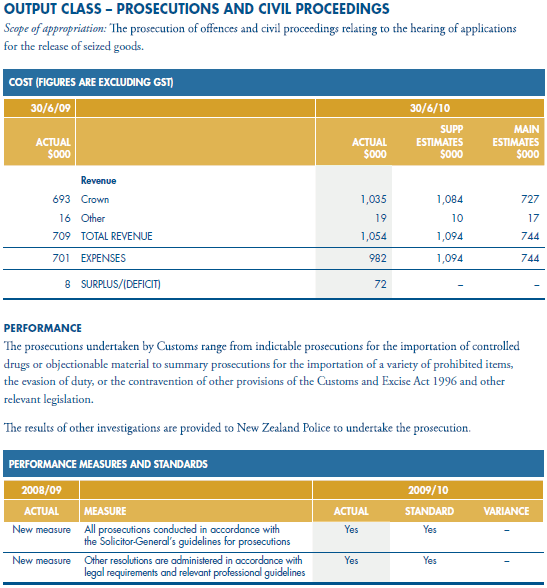
Figure 17 shows how Customs presented its output class results in its 2009/10 annual report. Customs has recently revised its output classes and no longer presents information using the output class and measures that follow. Nonetheless, we have included this example because it shows how a set of costs and performance measures can convey limited information and that entities should think about the analysis and explanation of their data, not just its presentation.
Figure 17
New Zealand Customs Service - presenting output class expenditure
Source: New Zealand Customs Service, Annual Report 2009/10, page 51.
5.27
In this example, the reader needs to refer to other sections of the annual report to understand the context of the costs and performance for this output class. The reader has to do more work, looking at previous annual reports, to understand the performance trend.
5.28
We decided to bring together six years of data from five of Customs' annual reports to see what expenditure trends were visible (see Figure 18). The data and its presentation were consistent for all five years, which helped our analysis.
Figure 18
New Zealand Customs Service - output class expenditure for prosecutions and civil proceedings over five years
| Output class | 2004/05 | 2005/06 | 2006/07 | 2007/08 | 2008/09 |
|---|---|---|---|---|---|
| Prosecutions and Civil Proceedings | $746,000 | $804,000 | $834,000 | $866,000 | $701,000 |
5.29
Although there has been some movement in expenditure in this output class, the overall trend is of significant reductions – some 6% between 2004/05 and 2008/09. However, what this reveals is still limited and raises questions such as:
- Is the reduction the result of volume reductions in workload?
- Is Customs taking on fewer prosecutions?
- Has Customs made efficiency improvements?
- Has this affected the results of its prosecutions?
5.30
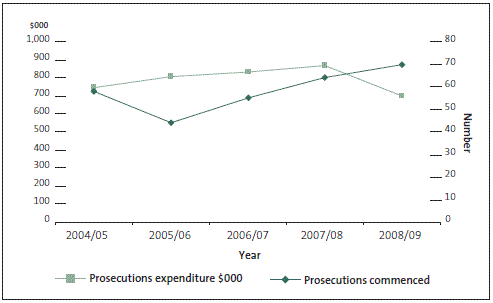
We have added another layer to the analysis by bringing the expenditure data on Customs' prosecutions together with the volume data contained in annual reports. The performance story becomes richer.
5.31
Given that the total expenditure on prosecutions has declined and the annual number of prosecutions started has increased, the unit cost of a prosecution declined 22% between 2004/05 and 2008/09 (see Figure 19).
Figure 19
New Zealand Customs Service - spending and outputs for prosecutions and civil proceedings over five years
5.32
Customs' annual reports also show that the success rate of prosecutions is higher than 95% and there is no adverse judicial comment on Customs' cases. Therefore, a reader could conclude that taxpayers are getting an efficient service from Custom's prosecution services.
5.33
Our exercise of bringing together five years12 of data and several sets of discrete information shows that a lot more could be told about a public entity's performance story. However, the exercise required much work and the performance story is incomplete because we do not know how Customs has achieved the improvements.
Conclusions on analysing trends in performance
5.34
Looking at performance over longer periods enables an assessment of the impact of different events, changes in practices or policies, and the difference any interventions adopted by the entity might be making. Or it could reveal improving or declining performance that needs to be addressed.
5.35
The PFA, CEA, and generally accepted accounting practice do not require this longer-term view, but they do not preclude it. We hope that many entities are monitoring their own performance over longer periods and using this internally as part of their management information and in their decision-making. If this is so, and the data is already available, there is no reason why it should not be included in annual reports. If this is not so, and longer-term analysis is not taking place, senior managers may not be getting the information they need to support sound and long-term decision-making.
5.36
Senior managers should consider establishing their own process for managing change in the measures and indicators used, so that changes do not compromise their ability (or that of the public) to establish a view of performance and effectiveness in achieving outcomes over the longer term.
5.37
As part of providing a longer-term picture of performance, public entities should be providing accurate analysis and commentary of their results, not just presenting their results as numbers. Without analysis and commentary, a reader can make uninformed judgements about a public entity's performance.
5.38
In our view, public entities should provide more thorough analysis of their results, delving deeper into what the data is telling them, and using what they find to improve their own performance. At a minimum, all public entities should be comparing results to forecasts, comparing annual results to their previous results, outlining what were the causal factors in any changes, explaining why variances occurred, and outlining what they plan to do differently as a result. This type of analysis and reporting should improve the usefulness of information provided to Ministers and to the public.
5.39
Ideally, a longer-term view with a greater depth of analysis attached would see public entities revealing their real performance story in a positive way - promoting improvements in their own and the public's understanding of their business.
| Recommendation 5 |
|---|
| We recommend that public entities identify services and results (costs, outputs, impacts, and outcomes) that would benefit from longer-term (5-10 year) trend analysis and report that analysis, supported with commentary, in their annual reports. |
12: In its 2009/10 annual report, Customs did not report the number of prosecutions started.
page top