Part 4: Measuring and reporting impacts, outcomes, and cost-effectiveness
The second part of the performance story
4.1
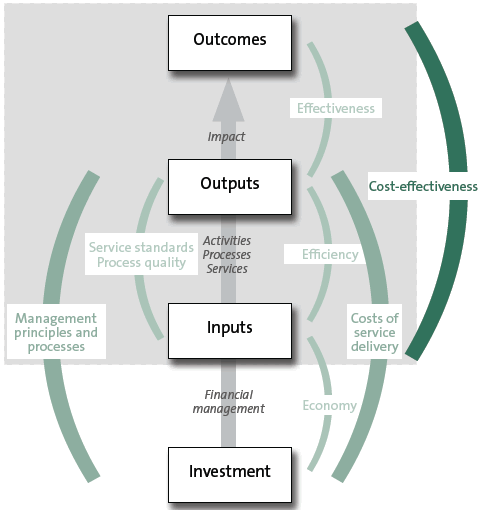
Cost-effectiveness is made up of effectiveness and efficiency – that is, the relationship between inputs, outputs, and outcomes.
4.2
Figure 8 highlights the second part of the performance analysis – measuring and reporting impacts and outcomes and cost-effectiveness.
Figure 8
Outcomes model, indicating areas of impact and outcomes and cost-effectiveness measures
4.3
Most public entities work towards a number of outcomes at the same time. Those outcomes often differ in terms of how long they might take to achieve, how complex and difficult they are, and what portion of society they might affect. Most public entities also recognise the difficulties of measuring outcomes to which they might be only one contributor among many, or that might take years to achieve.
4.4
These difficulties can be addressed by separating outcomes that are long term, or "strategic" outcomes, from "immediate result" outcomes that are the direct consequence of the services or activities of the entity. These "immediate result" outcomes are often referred to as "impacts". They represent the relatively immediate or direct effect on stakeholders of the entity's outputs.
4.5
Strategic outcomes and impacts are both important. However, when measured alongside the cost-effectiveness of outputs, impact measures provide management with a better picture of performance. The impact measures gauge a more direct effect of an entity's activities and services: cost-effectiveness reflects the value for money of these services. For services to be truly effective, they must also be cost-effective, because few taxpayers are willing to fund services that achieve a positive impact at an unaffordable price.
4.6
There is a danger in creating measures that are convenient because the information can be easily captured or recorded rather than having measures that are important and relevant to assess service delivery. We encourage public entities to seek impact measures that provide a picture of what actually achieves results. To invest public funding wisely, public entities need to continue to seek ways of measuring their contribution to outcomes, however difficult this may be.
4.7
Similarly, the cost-effectiveness of services, initiatives, and other outputs are important matters for public entities to consider in determining where and when to invest resources, and when and how to adjust their strategies or change aspects of their operating model.
4.8
At its simplest, cost-effectiveness is about the relationship between the investment – the input of dollars and resources – to the result, or the impact or outcome achieved.
4.9
Some entities carry out internal assessment of cost-effectiveness to use in, for example, decision-making, internal budget allocations, and developing performance improvement initiatives. There might be more examples of this than are currently included in annual reports, statements of intent, or forecast SSPs. If there are, we would like to see the results of this analysis included in annual reports.
4.10
One of the difficulties for entities is how much to invest in gathering and analysing the data that will help to determine cost-effectiveness. Entities need to consider ways of achieving this data collection that are the most efficient possible, and do not adversely affect services or customers.
4.11
We have included examples to help entities consider and determine their own approach to measuring their impacts and reporting the cost-effectiveness of their services. The examples that show how to measure impacts are taken directly from entities' annual reports. We have created the examples that show cost-effectiveness, using information in those entities' annual reports.
Examples of measuring impacts and outcomes
Department of Corrections
4.12
This example features the strategy used by the Department of Corrections (Corrections) to reduce alcohol and drug use among prisoners:
A high proportion of prisoners have a lifetime incidence of drug dependency or abuse, and a high percentage of crime is committed by offenders who are affected by drugs or alcohol on the day leading up to the offence. Drug use is also a major security problem in prison and causes problems for the effective management and rehabilitation of prisoners. It can also result in health problems for both individual prisoners and the wider community, and promote the transmission of communicable diseases.
The Department is committed to reducing drug and alcohol use in prisons as highlighted in the Drug and Alcohol Strategy to cover the period 2009-2014. The strategy focuses on:
- enhancing efforts to reduce the supply of drugs to prisoners;
- strengthening efforts to reduce prisoners' demand for drugs; and
- increasing attention on reducing the harm caused by drugs.7
4.13
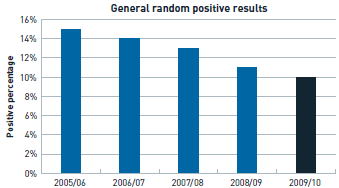
To test the effectiveness of this strategy, Corrections randomly drug tests inmates, and publishes the results in its annual report.
4.14
Corrections understands that if its strategies to reduce alcohol and drug use within prisons are effective then the rate of drug usage will decline over time. To measure this rate over time, it randomly drug tests the inmates. Figure 9 shows a trend of declining drug usage. This is the hardest evidence available to test the effectiveness of Corrections' strategies. It does not prove that the only cause for this trend is Corrections' actions, but it is convincing evidence in support of its approach.
Figure 9
Department of Corrections - results of random drug testing in prisons
Source: Department of Corrections, Annual Report 2009/10, page 10.
4.15
Corrections completed similar analysis for other services, including recidivism and escapes from custody. Again, as is common with some entities' annual reports, the reader cannot see or estimate the costs of the drug and alcohol rehabilitation services because cost data is provided at an output class level. However, Corrections appears to be clear about which services are directly targeted (and could be costed) at reducing drug usage in prisons:
This output entails the identification of drug users in prisons through the administration of three random drug screening programmes and other drug screening tests. It includes the costs of checkpoint drug control activities, drug dog services, and other activities undertaken alone or with other agencies.8
4.16
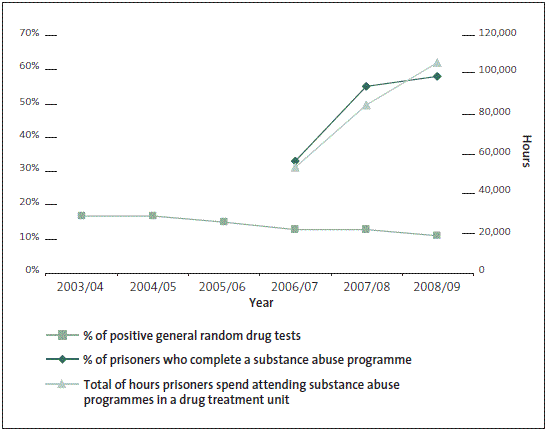
These costs, plus the rehabilitation costs, would be Corrections' total expenditure invested in reducing the use of drugs in prison. Trends in prisoner hours on programmes and the percentage of prisoners who complete the programmes appear to be associated with the lowering trend of positive drug tests (see Figure 10). The evidence indicates that the strategy appears to be working. However, data for three years is not enough to make any definitive statements – that would require data spanning five to 10 years.
4.17
Figure 10 does not appear in Corrections' annual reports – we have created it using data in those reports. We created it to show how the story of effectiveness can be told, using data already collected and reported.9
Figure 10
Department of Corrections — effectiveness of drug and alcohol rehabilitation services
4.18
Corrections is demonstrating good practice in measuring the effect of its drug and alcohol reduction strategies. Random sampling of inmates for drugs and alcohol measures the effectiveness of its drug and alcohol prevention strategies. The increase in the total hours prisoners spend attending substance abuse programmes and the percentage that complete a substance abuse programme appear to have resulted in a declining trend in the percentage of positive general random drug tests. However, the result could have been attributable to a number of other interventions, such as improving the quality of prison security measures or prisoners choosing not to take drugs – the reasons are not clear and Corrections could include some commentary to explain its performance.
Accident Compensation Corporation
4.19
The Accident Compensation Corporation (ACC) measures rehabilitation rates based on the number of days of weekly compensation paid to clients before they leave the scheme. This indicates the duration of financial support provided to its clients before they can again become self-supporting (that is, return to paid employment).
4.20
ACC's 2009/10 annual report relates the above performance measure directly to its outcome "Rehabilitate injured people in New Zealand more efficiently":
This outcome aims to ensure that people with injuries covered by the Scheme get the rehabilitation necessary to return to work or everyday life, at a reasonable cost.10
4.21
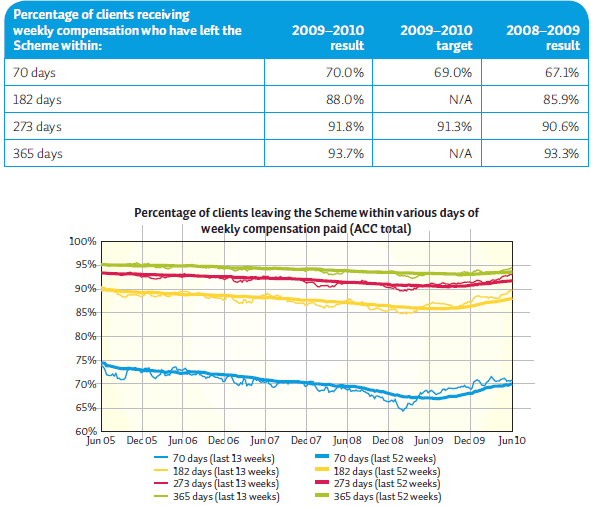
Figure 11 shows ACC's progress in meeting targets and achieving this outcome.
Figure 11
Accident Compensation Corporation – effectiveness of rehabilitation programmes
Source: Accident Compensation Corporation, Annual Report 2009/10, page 23.
4.22
Improved performance in all time categories is evident from about December 2009 onwards. ACC states that:
In order to improve rehabilitation performance, which had been declining since 2005, ACC implemented a new service delivery model in July 2009 that aligns with best practice claims management for injury compensation schemes.11
4.23
Although it is a very short time since the introduction of its new service delivery model, ACC's use of measures of rehabilitation rates, and its practice of reporting these over a long time, provides a clear picture of the impact of its activities on claims rehabilitation management. ACC was able to identify the declining rehabilitation rates and to develop and implement a new service delivery model to address this trend. Figure 11 is a good example of the advantages of measuring the impact of an entity's outputs on its outcomes.
Examples of reporting cost-effectiveness
New Zealand Customs Service
4.24
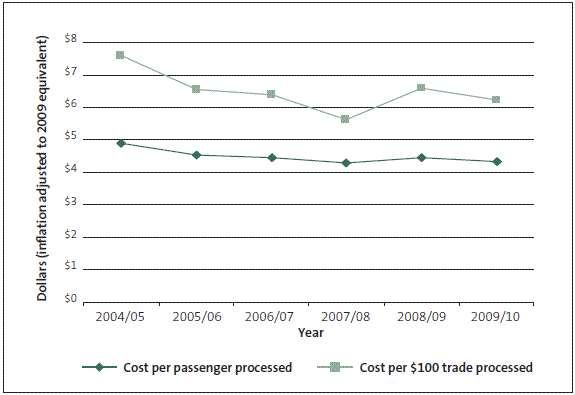
Figure 12 demonstrates the difficulty and usefulness of developing and reporting cost-effectiveness. Figure 12 shows information Customs is developing for reporting in its forthcoming annual reports - the cost for each passenger processed and the cost for each $100 of trade processed.
Figure 12
New Zealand Customs Service – processing cost measures
4.25
The graph in Figure 12 relates two sets of data (expenses and volume) to provide a simple picture of cost-effectiveness over time. Although a simple depiction, the graph suggests that Customs has improved its cost-effectiveness and the value of its services in processing passengers and trade. Clearly, several internal and external factors will influence the cost of processing passengers and trade volumes. If Customs thought this a useful method for setting out longer-term results, it could improve this information by explaining factors that are likely to influence the achievement trend, and factors that could affect the results.
4.26
Customs has adjusted the cost of processing to reflect inflation, so Figure 12 is stated in 2009/10 dollars. This provides a more accurate picture of effectiveness and cost-effectiveness over time.
4.27
To make the performance story richer, Customs could include the volume of passengers and trade processed to relate quantity to cost-effectiveness.
Sport and Recreation New Zealand
4.28
The investment in high-performance sport made by Sport and Recreation New Zealand (SPARC) provides another example of cost-effectiveness reporting. SPARC provided us with the data on investment in high-performance sport and medal achievement so we could see the effect of investment on the number of medals achieved.
4.29
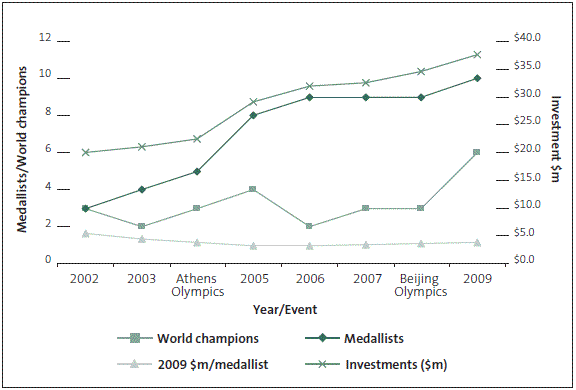
We have then used SPARC's data to compile and produce Figure 13. It shows the cost-effectiveness of SPARC's investments – the high correlation between investment and medals is clearly visible. To reflect inflation, the $m/medallist indicators are stated in 2009 dollars.
Figure 13
Sport and Recreation New Zealand – cost-effectiveness of investing in Olympic sports
4.30
Government investment in high-performance athletes, coaches, and systems and organisations for Olympic sports has increased the number of medals won at Olympic Games and World Championships. The unit cost of each medal has declined over eight years. Therefore, SPARC can claim that the cost-effectiveness (by medallist) of its investment improved between 2002 and 2006, and since then has been relatively steady. However, the graph is a simplistic view of achievement because there are other influences (such as advice, co-ordinators, and strategy) that contribute to the results. Also, it takes years to train a potential Olympic medallist or world champion so there is a time lag between investment and results.
4.31
Continuing to report this performance over time would assure SPARC, the Government, and the public about the cost-effective use of taxpayer funds.
Conclusions on measuring and reporting impacts, outcomes, and cost-effectiveness
4.32
We acknowledge that measuring impacts and outcomes and assessing cost-effectiveness is difficult. Measuring only the inputs, outputs, and service standards provides part of the performance story. It is important to continue to measure these aspects because they form the foundation for more in-depth performance analysis. Public entities should also try to find ways to measure and report on their performance in terms of its contribution to achieving the desired outcomes.
4.33
We would like to see public entities focusing on their immediate impacts (and outcomes) – those that are a result of their unique set of activities – and putting in place means of monitoring and measuring their performance. A combination of the above will begin to provide a more informed view of the effectiveness of entities' current actions and strategies. Adding cost-effectiveness information will complete the picture, in terms of assessing the impact and value of services.
4.34
The examples discussed in this Part show the value of impact measurement and cost-effectiveness reporting for determining value for money in the services provided, and deciding when and how to intervene if the value or the impact is declining.
4.35
Insufficient cost-effectiveness reporting is not uncommon in the public sector. The challenge appears to be related to the clarity and definition of outcomes and the more immediate impacts that can be directly linked to each public entity's activities. The better defined the impacts and outcomes are, the more straightforward it is to determine how to report the cost-effectiveness of services provided or actions employed to achieve them.
4.36
Measuring impacts and assessing cost-effectiveness are important to provide assurance that value is provided to taxpayers, and that management decision-making is based on robust analysis. It is possible for most types of outputs to be measured for impact and cost-effectiveness, although there are significant challenges in achieving this for some outputs. However, given the value of measuring this over time, we consider it is something that public entities should try to do, and should consistently promote.
| Recommendation 3 |
|---|
| We recommend that public entities report on the impacts and outcomes that result from delivering their outputs. |
| Recommendation 4 |
| We recommend that public entities analyse and evaluate their service performance, cost of service, and impact and outcome results to assess and report on cost-effectiveness. |
7: Department of Corrections, Annual Report 2008/09, page 13.
8: Department of Corrections, Annual Report 2006/07, page 95.
9: Corrections has changed its performance measures, so the 2009/10 results were not available in its 2009/10 annual report.
10: Accident Compensation Corporation, Annual Report 2009/10, page 9.
11: Accident Compensation Corporation, Annual Report 2009/10, page 22.
page top