Part 2: Our output classes, performance measures, and targets (including Statement of service performance)
Our output classes and the outputs within those classes are:
- Audit and assurance services
- Supporting accountability to Parliament
- Performance audits and inquiries
Audit and assurance services
Background and context
In 2009/10, annual audits and other assurance services accounted for 87% of our total expenditure. The major portion of the output class relates to annual audits of public entities that are required by statute to be carried out.
The main purpose of an annual audit is to provide independent assurance about the fair disclosure of the financial information – and, in many instances non-financial information – within a public entity's annual report. An audit involves a range of procedures, tests, and management and governance enquiries to support our opinion.
There are two main products from an annual audit:
- the audit report; and
- the management report.
For some public entities, there is also a financial review report.
The audit report is addressed to the readers of the financial statements and, where applicable, of the service performance information. It provides the auditor's independent opinion (the audit opinion) on whether the financial statements (and, where applicable, the service performance information) fairly reflect the public entity's financial performance and position. If the financial statements fairly reflect the public entity's financial performance and position (and, where applicable, the service performance information), the auditor will issue an audit report with an unqualified opinion. However, if the auditor identifies a material misstatement in the financial statements or service performance information, the auditor will issue a qualified opinion.
The management report is addressed to the governing body or the senior management of public entities. It sets out any significant issues identified by the auditor during the audit and provides recommendations for improving the public entity's controls, systems, and processes.
Where public entities are subject to financial review by a select committee, we also report the results of annual audits to responsible Ministers and select committees. The report includes a grading for public entities, based on our assessment of their management control environment, and financial (and service performance, where required) systems and controls.
In carrying out annual audits, auditors consider matters of authority, probity, performance, waste, and accountability. Where appropriate, they make recommendations for improvements to the governors and managers of public entities. We also use our annual audits to gather information and knowledge about public entities to assist us in advising Parliament and other stakeholders and to help determine the work we do in our performance audits, inquiries, and good practice guides.
Key processes supporting annual audits
Delivery of annual audits is supported by several key processes, including:
- appointing auditors and monitoring audit fees;
- setting the Auditor-General's Auditing Standards;
- maintaining auditor independence; and
- quality assurance.
Appointing auditors and monitoring audit fees
The Auditor-General appoints auditors to carry out the annual audits of all public entities. These auditors are appointed from a group of about 50 audit service providers. The group includes Audit New Zealand and private sector accounting firms, which range from the four major chartered accounting firms to sole practitioners. Most audits are allocated directly to an auditor, but from time to time an auditor is appointed to carry out an audit after a competitive tender.
Because we mainly use an allocation model, we monitor audit fees at the point of negotiation between the appointed auditor and the public entity. We also provide a comparative analysis to help resolve any concerns about proposed audit fees. Our objective in monitoring fees is to ensure that fees are reasonable in that they are based on:
- realistic hours (that is, hours that reflect the nature and extent of work required);
- an appropriate audit team mix; and
- charge-out rates that are in line with market rates.
We aim for fees that are fair to the public entities and also provide a fair return to the auditors for the work required by them to meet the Auditor-General's Auditing Standards.
During 2009/10, the Auditor-General appointed or reappointed auditors (except where a change of auditor was made within the same audit service provider) to conduct audits of 2456 schools and 392 other public entities and their subsidiaries.
Setting the Auditor-General's Auditing Standards
Section 23 of the Public Audit Act 2001 requires the auditing standards of the Auditor-General to be published, by way of a report to the House of Representatives, "at least once every 3 years". The Auditor-General's Auditing Standards were most recently published in May 2008. These standards are available on our website (www.oag.govt.nz).
Section 23 also requires each annual report of the Auditor-General to include a description of any significant changes made to the standards during the year. During 2009/10, we updated only Auditing Standard 1: Reporting to the OAG (AG-1), to clarify the requirements for appointed auditors to electronically report the results of annual audits to the OAG.
Work is currently under way to incorporate into the Auditor-General's Auditing Standards any changes considered necessary in respect of a new set of auditing standards that have been progressively introduced by the New Zealand Institute of Chartered Accountants for application in New Zealand (New Zealand equivalents to International Standards on Auditing). We intend to issue updated Auditor-General's Auditing Standards later this calendar year, which will be earlier than the next scheduled publication date of May 2011.
Maintaining auditor independence
High independence standards are set for both the Auditor-General's employees and appointed auditors from private sector accounting firms. Compliance with these standards is monitored regularly. Any threats to auditor independence that were identified during the year were subject to mitigation actions that the Auditor-General considered appropriate to either eliminate the threats or reduce them to an acceptable level.
Quality assurance
We carry out quality assurance reviews of appointed auditors to ensure that they have complied with the relevant professional standards, as well as the Auditor-General's own published auditing standards. We aim to review the performance of each of our appointed auditors at least once every three years. There are five levels of quality assurance rating, assessed using the reviewers' overall judgement of the quality of the audit work carried out. The five levels are "excellent", "very good", "good", "satisfactory", and "re-review".
We also carry out reviews of each firm's quality control systems that are designed to provide assurance over the organisational factors that affect audit quality. These reviews are carried out on a risk basis.
Main impact measures and standards
We report a range of impact measures and standards (see Figure 3 table and graphs), which are designed to help gauge the impact of our annual audits and other audits and assurance services.
Figure 3
Actual performance against impact measures and standards for output class: Audit and assurance services
| 2009/10 forecast main impact measures and standards |
2009/10 Actual |
2008/09 Actual |
2007/08 Actual |
|---|---|---|---|
| The number of audited financial reports issued for public entities within the statutory timeframe is improved (or at least maintained), compared to each of the previous two years.a | Total audits due for completion in year: 3940 On time: 88% |
Total audits due for completion in year: 3908 On time: 82%b |
Total audits due for completion in year: 3946 On time: 79%b |
| The number of audited financial reports for public entities that contain qualified audit opinions is reduced (or at least maintained), compared to each of the previous two years. | Total qualified opinions: 112 (2.8%) | Total qualified opinions: 95 (2.4%) | Total qualified opinions: 91 (2.3%) |
| Public entities' acceptance of Audit New Zealand'sc management report recommendations is improved (or at least maintained), measured against each of the previous two years. | Accepted: 79% Rejected: 10% Noted, under consideration or not responded to: 11% |
Accepted: 79% Rejected: 11% Noted, under consideration, or not responded to: 10% |
Accepted: 72% Rejected: 4% Noted, under consideration, or not responded to: 24% |
| Central government entities' management control environment, and financial information and service performanced information systems and controls are improved (or at least maintained), measured against each of the previous two years. | See graphs below | See graphs below | See graphs below |
a: Audits may not have been completed for several different reasons, including that the entity has not produced financial statements for audit, that the audit of the previous year's financial statements has not been completed (and must be audited first), that there are delays on the part of the entity in responding to audit queries, that the audit is under way but the financial statements have not been available to us for more than 30 days, and that the audit is complete and waiting for the entity's governing body to adopt the financial statements.
b: These are not the same results as those reported in our 2008/09 annual report because the comparative figures for State-owned Enterprises and Crown Research Institutes have been amended to reflect the legal position applicable to reporting by subsidiaries in these two sectors. In previous years, we have assessed the timeliness of completion of subsidiaries based on the statutory deadline of their parent entities (that is, within three months of balance date). The assessment of timeliness of completion of subsidiaries is now correctly based on a statutory deadline of five months after balance date.
c: In future, we plan to report on public entities' acceptance of management report recommendations from our range of audit service providers, rather than just Audit New Zealand.
d: Service performance information and associated systems and controls were graded for the first time under the new framework as part of the 2008/09 audits carried out in 2009/10; comparative results are therefore not available for prior years.
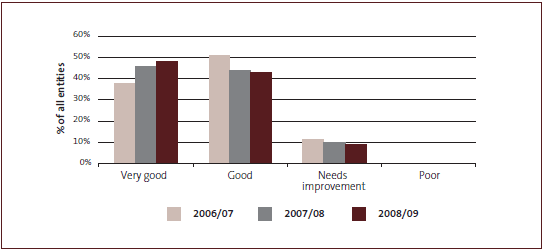
Management control environment – grades for 2006/07 to 2008/09, as percentages
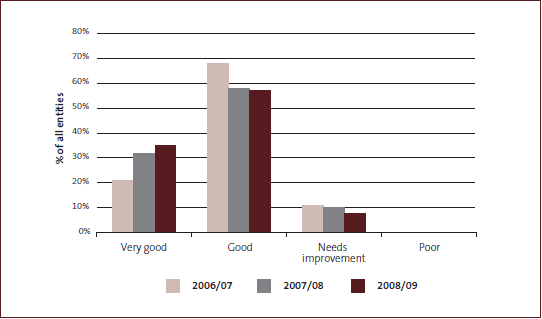
Financial information systems and controls – grades for 2006/07 to 2008/09, as percentages
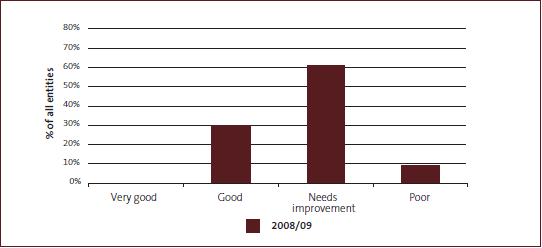
Service performance information and associated systems and controls – grades for 2008/09, as percentages
Overall comments on the impact of our annual audits and other audits and assurance services
We are generally pleased with the trends in our impact measures and standards as follows:
- an increasing percentage of audited financial statements being completed within statutory deadlines;
- a low percentage of qualified audit opinions being maintained;
- a high percentage of acceptance by public entities of our recommendations for improvement being maintained;
- a high percentage of "good" and "very good" grades assigned to public entities' systems and controls being maintained.
Detailed comments on the impact measures
Completion of audited financial statements within statutory deadlines
An important aspect of the performance of public entities is issuing audited financial statements within statutory timeframes so that those interested in the accountability of public entities receive our audit assurance as soon as possible after the year end.
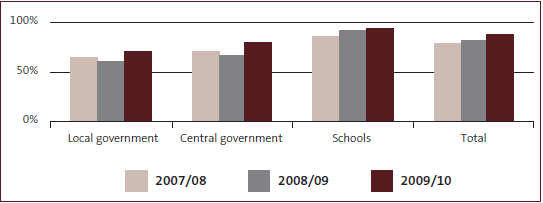
As Figure 4 shows, not all public entities met their statutory timeframes. However, the timeliness of audit completions improved from the previous year, with 88% of the audits due for completion in the year being finished within the statutory timeframe compared to 82% and 79% in the previous two years.
Figure 4 shows the number of audits completed on time, together with a breakdown by sector.
Figure 4
Audits completed on time
| Sectora | Total audits due in 2009/10b |
Number on time in 2009/10 |
Percentage on time in 2009/10 |
Percentage on time in 2008/09 |
Percentage on time in 2007/08 |
|---|---|---|---|---|---|
| Central government | |||||
| Government departments | 41 | 41 | 100% | 100% | 100% |
| State-owned enterprisesc | 127 | 119 | 94% | 85% | 70% |
| District health boards | 47 | 34 | 72% | 67% | 64% |
| Tertiary education institutions | 140 | 104 | 74% | 61% | 72% |
| Crown Research Institutesc | 61 | 59 | 97% | 61% | 68% |
| Other entitiesd | 317 | 226 | 71% | 61% | 67% |
| Central government total | 733 | 583 | 80% | 67% | 70% |
| Local government | |||||
| Local authorities | 85 | 84 | 99% | 91% | 88% |
| Other council organisations | 215 | 174 | 81% | 72% | 77% |
| Energy companies | 63 | 56 | 89% | 86% | 75% |
| Ports and airports | 60 | 52 | 87% | 82% | 80% |
| Licensing trusts | 44 | 32 | 73% | 41% | 64% |
| Fish and game councils | 14 | 14 | 100% | 100% | 100% |
| Other local governmente | 207 | 76 | 37% | 26% | 37% |
| Local government total | 688 | 488 | 71% | 60% | 64% |
| Schools | 2519 | 2405 | 95% | 93% | 86% |
| Total for all sectors | 3940 | 3476 | 88% | 82% | 79% |
a: In all of the sectors except Government departments and Local authorities, we have included any related subsidiaries within the total of the main entities.
b: "Total audits due" is the number of audits in each sector which had an expected completion date between 1 July 2009 and 30 June 2010.
c: The comparative figures for State-owned enterprises and Crown Research Institutes have been amended to reflect the legal position applicable to reporting by subsidiaries in these two sectors. In previous years, we have assessed the timeliness of completion of subsidiaries based on the statutory deadline of their parent entities (that is, within three months of balance date). The assessment of timeliness of completion of subsidiaries is now correctly based on a statutory deadline of five months after balance date.
d: The "Other entities" group in the central government sector includes Māori Trust Boards, Rural Education Activity Programmes, section 19 audits, subsidiaries of government departments, crown entities not separately identified, crown agents, and miscellaneous other central government entities.
e: The "Other local government" group includes Administering Bodies, Domain and Reserve Boards, Public Hall Boards and Cemeteries.
Central government sector
In the central government sector, delays in completing subsidiary audits are the main reason for the overall number of audits not completed on time. Over the past year, we have worked with our appointed auditors to ensure that subsidiary audits are completed in a timely way. It is therefore pleasing to see the increase in the number of audits completed on time, particularly in the State-owned enterprise and Crown Research Institute sectors. We will continue to work with our appointed auditors in the year ahead to further improve the timely completion of audits, particularly in the district health board and tertiary education institution sectors.
Local government sector
In the local government sector, there has also been an improvement in audits completed on time.
As noted in last year's annual report, the effect of diverting resources to the triennial audit of LTCCPs in 2008/09 contributed to a low clearance of annual audits within statutory timeframes. There was no such pressure in 2009/10. As a result, there was a substantial improvement in the number of audits in the local government sector being completed within the statutory timeframe compared with the previous two years.
Schools sector
The majority of the public entities subject to audit by the Auditor-General are schools. We aim to complete over 90% of school audits within the statutory timeframe and 99% within 12 months of balance date. The statutory date for school audits is 31 May, only a month before the end of our reporting year, so there will always be a reasonable number of school audits in arrears at 30 June.
We are pleased to report that, in 2009/10, we managed to achieve a higher level of performance than in any previous year, with more than 95% of audits being completed by the statutory deadline and more than 99% being completed within 12 months of balance date.
Results of our annual audit opinions
There are three types of qualified audit opinions – a disclaimer of opinion, an adverse opinion, and an "except for" opinion.
Figure 5 provides an analysis of all qualified audit reports issued in 2009/10. Information for the previous two years is provided for comparison.
Figure 5
Qualified audit reports issued
| Type of qualified audit report | 2009/10 | 2008/09 | 2007/08 |
|---|---|---|---|
| Disclaimer of opinion | 3 | 4 | 1 |
| Adverse opinion | 12 | 13 | 12 |
| "Except for" opinion | 97 | 78 | 78 |
| Total of qualified audit reports | 112 | 95 | 91 |
| Total of all audit reports due | 3940 | 3908 | 3946 |
| % qualified | 2.8% | 2.4% | 2.3% |
The proportion of qualified audit reports issued compared to the number of audits due for completion was slightly higher during 2009/10. This is due in part to the fact that we cleared a lot of audit arrears during 2009/10 that included qualified opinions.
Details of the non-standard audit opinions issued in the 2009 calendar year are included in our parliamentary papers B.29[10a] and B.29[10c]:
- Central government: Results of the 2008/09 audits; and
- Local government: Results of the 2008/09 audits.
Acceptance of Audit New Zealand's management report recommendations
Figure 6 provides an analysis of the acceptance by public entities of Audit New Zealand‘s management report recommendations. We are pleased to note that the increased level of acceptance of our recommendations in 2008/09 has been maintained in 2009/10.
Figure 6
Acceptance of Audit New Zealand's management report recommendations
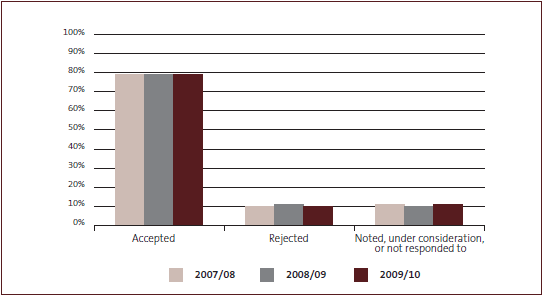
In future years, we intend to report on acceptance of management report recommendations across the range of our audit service providers, rather than just Audit New Zealand.
Results of our grading of public entities' systems and controls
The percentage of public entities receiving a grading of either "good" or "very good" has increased marginally during the year for our assessment of entities':
- management control environment;
- financial systems and controls.
We have not previously graded service performance information and associated systems and therefore cannot comment on the trend in grading of this aspect.
Output measures and standards
We also report a range of output measures and standards (see Figure 7) that are designed to assess our own performance in carrying out annual audits and other audits and assurance services.
Figure 7
Actual performance against output delivery measures and standards for output class: Audit and assurance services
| 2009/10 forecast measures and standards of output delivery | 2009/10 Actual |
2008/09 Actual |
2007/08 Actual |
|---|---|---|---|
| Less than 10% of the outstanding audit reports at 30 June 2010 are because of inaction on our part. | Total arrears at 30 June: 313 Due to inaction on our part: 42 to 47%* |
Total arrears at 30 June: 429 Due to inaction on our part: 49% |
Total arrears at 30 June: 453 Due to inaction on our part: 55% |
| All management reports are issued within six weeks of issuing the audit report. | Issued within six weeks: 95% | Issued within six weeks: 93% | Issued within six weeks: 93% |
| No outstanding LTCCP opinions at 30 June of the year in which LTCCPs are to be adopted by local authorities are because of inaction on our part. All LTCCP management reports are issued within six weeks of issuing the LTCCP opinion |
Not applicable – LTCCPs are required to be adopted and audited every three years. | 8% of LTCCP opinions were outstanding at 30 June 2009, one of which remained outstanding at 31 August 2009. No outstanding opinions were due to inaction on our part. 85% of management reports were issued within six weeks of issuing the LTCCP opinion. |
Not applicable – LTCCPs are required to be adopted and audited every three years. |
| Client satisfaction survey results show that, overall, 75% of respondents are satisfied with the quality of audit work (including the expertise of staff and the quality of a public entity's relationship with their audit service provider). | On a scale of 1 to 10, 83% of respondents gave overall service ratings of 7 or greater. | On a scale of 1 to 10, 80% of respondents gave overall service ratings of 7 or greater. | On a scale of 1 to 10, 75% of respondents gave overall service ratings of 7 or greater. |
| Quality assurance reviews for all appointed auditors are completed during a three-year period. Of the auditors reviewed in any given year, 95% achieve a result of satisfactory or better. | All 42 QA reviews due were completed. Achieved satisfactory or better: 98% |
All 45 QA reviews due were completed. Achieved satisfactory or better: 100% |
All 44 QA reviews due were completed. Achieved satisfactory or better: 93% |
| An annual independent review of our processes confirms the probity and objectivity of the methods and systems that we use to allocate and tender audits, and monitor the reasonableness of audit fees. | Review undertaken and confirmation provided. | Review undertaken and confirmation provided. | Review undertaken and confirmation provided. |
| The Officers of Parliament Committee accepts any significant proposals for an appropriation increase in audit fees and expenses. | No significant proposal made for an appropriation increase in audit fees and expenses. | No significant proposal made for an appropriation increase in audit fees and expenses. However, a request for an increase in appropriation of $50,000 for audits of smaller entities (Cemetery Trusts and Reserve Boards) was not accepted by the Officers of Parliament Committee. | No significant proposal made for an appropriation increase in audit fees and expenses. |
* This year, we have estimated the percentage of arrears due to inaction on our part. This is because we are not near our target of 10% and it is an expensive measure to produce. We have given our estimate as a range, as it is not a precise measure. For 2010/11, our target is 30%, so we will measure the result as accurately as possible for our 2010/11 annual report.
Overall comments on our performance in carrying out annual audits and other audits and assurance services
We are generally pleased with the trends in our output measures and standards as follows:
- a significant reduction in the number of audits in arrears at 30 June;
- a continuing decline in the percentage of audit arrears being due to inaction on our part;
- a slight improvement in the timeliness of issuance of management reports to public entities following the completion of our audits;
- a continuing improvement in the level of client satisfaction as expressed by a sample of public entities;
- maintenance of a high percentage of appointed auditors receiving a quality assurance grade of "satisfactory" or better;
- confirmation from an independent review that our processes for audit appointments and audit fee monitoring have been carried out with due probity and objectivity.
Detailed comments on our own performance in carrying out annual audits and other audits and assurance services
Audit arrears
Overall, the number of arrears has reduced from 453 in 2008 to 429 in 2009 to 313 this year. This is because there has been a significant effort by appointed auditors to work with public entities in completing and auditing their annual reports. Figure 8 provides an analysis of these arrears.
Figure 8
Audits outstanding at 30 June
| Sector | Total audits due in 2009/10 | Arrears at 30 June 2010 | Percentage of arrears at 30 June 2010 | Arrears at 30 June 2009 | Arrears at 30 June 2008 |
|---|---|---|---|---|---|
| Central government | |||||
| Government departments | 41 | 0 | 0% | 0 | 0 |
| State-owned enterprises | 127 | 1 | 1% | 0 | 0 |
| District health boards | 47 | 14 | 30% | 12 | 12 |
| Tertiary education institutions | 140 | 32 | 23% | 42 | 23 |
| Crown Research Institutes | 61 | 1 | 2% | 0 | 4 |
| Other entities | 317 | 47 | 15% | 69 | 50 |
| Central government total | 733 | 95 | 13% | 123 | 89 |
| Local government | |||||
| Local authorities | 85 | 0 | 0% | 0 | 4 |
| Other council organisations | 215 | 14 | 7% | 24 | 17 |
| Energy companies | 63 | 7 | 11% | 8 | 12 |
| Ports and airports | 60 | 6 | 10% | 5 | 2 |
| Licensing trusts | 44 | 8 | 18% | 9 | 8 |
| Fish and game councils | 14 | 0 | 0% | 0 | 0 |
| Other local government | 207 | 119 | 57% | 163 | 141 |
| Local government total | 688 | 154 | 22% | 209 | 184 |
| Schools | 2519 | 64 | 3% | 97 | 180 |
| Total for all sectors | 3940 | 313 | 8% | 429 | 453 |
In the local government sector, the last two years saw priority given to the audit work in larger public entities. This was at the expense of smaller audits, such as cemeteries and administering bodies (for example, hall boards). Clearing these smaller audits can vary substantially, and at times requires auditors to follow up on obtaining annual reports before the audits are completed. In the prior year, the ability to carry out this work was affected by the commitment of auditors to the triennial audits of LTCCPs. There was no such commitment in 2009/10.
Clearing small audits will continue to be a focus for appointed auditors in the year ahead.
Our estimate is that between 42% and 47% of the arrears at 30 June 2010 were caused by inaction on our part, compared with 49% at the end of the previous year. The target of less than 10% of the outstanding audit reports at 30 June being caused by inaction on our part is particularly challenging. We will continue to work with our audit service providers to ensure that the main obstacles to prompt completion of audits are removed, with the objective of significantly reducing the number of arrears in total and those that are our responsibility.
We have also decided to increase the target for inaction in 2010/11. Rather than only 10% of outstanding audit reports being caused by inaction on our part, we will be aiming for not more than 30%. This revised target is realistic, particularly if arrears are brought down to about 250 in total.
The number of audits in arrears in the central government sector has decreased to 95 in 2010 from 123 in 2009, but it is still higher than the 89 audits that were in arrears in 2008. While it is pleasing to see that progress in reducing the number of arrears has been made, particularly in the "other entity" sector, we also intend to focus on reducing arrears in the district health board and tertiary education institution sectors. A number of Māori Trust Board audits are still in arrears, some for more than a year. We continue to work with the sector to complete these audits, and have reported separately to Parliament on our work on this topic.
The number of audits in arrears in the local government sector has decreased to 154 in 2010 from 209 in 2009. This reflects the clearance of a number of arrears of small audits in this sector such as cemeteries and administering bodies.
The number of school audits outstanding at 30 June 2010 was the lowest on record for the end of our reporting period. We estimate that no more than 10% of the school arrears at 30 June 2010 were caused by inaction on the part of the appointed auditor or ourselves.
Management reports issued within six weeks
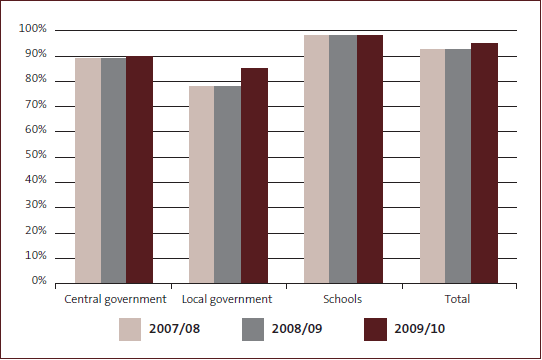
This year we issued 95% of our draft or final management reports within six weeks of signing the audit report, which is about the same level of performance as in the previous two years. See Figure 9.
Figure 9
Management reports issued within six weeks
| Sector* | Total due in 2009/10 | Total on time in 2009/10 | Percentage on time in 2009/10 | Percentage on time in 2008/09 | Percentage on time in 2007/08 |
|---|---|---|---|---|---|
| Central government | |||||
| Government departments | 41 | 40 | 98% | 90% | 100% |
| State-owned enterprises | 128 | 116 | 91% | 97% | 87% |
| District health boards | 43 | 38 | 88% | 88% | 84% |
| Tertiary education institutions | 142 | 130 | 92% | 75% | 80% |
| Crown Research Institutes | 66 | 65 | 98% | 100% | 100% |
| Other entities | 322 | 279 | 87% | 89% | 90% |
| Central government total | 742 | 668 | 90% | 89% | 89% |
| Local government | |||||
| Local authorities | 85 | 66 | 78% | 70% | 64% |
| Other council organisations | 225 | 190 | 84% | 74% | 70% |
| Energy companies | 62 | 50 | 81% | 87% | 97% |
| Ports and airports | 54 | 45 | 83% | 87% | 81% |
| Licensing trusts | 50 | 44 | 88% | 51% | 67% |
| Fish and game councils | 14 | 14 | 100% | 93% | 100% |
| Other local government | 187 | 168 | 90% | 86% | 85% |
| Local government total | 677 | 577 | 85% | 78% | 78% |
| Schools | 2824 | 2781 | 98% | 98% | 98% |
| Total for all sectors | 4243 | 4026 | 95% | 93% | 93% |
* The total number of management reports due in 2009/10 is not the same as the "Total audits due in 2009/10" shown in Figures 4 and 8. This is because the due dates of management reports are dependent on, but different to, the dates that audits are completed. The dates used are audit reports issued between 20 May 2009 and 19 May 2010, which is six weeks before the year end.
We did not achieve our target of issuing all management reports within six weeks of issuing the audit report. However, our achievement rate of 95% was similar to the previous two years. The completion rate on the schools sector remained high at 98%. In the central and local government sectors, our completion rates were 90% and 85% respectively.
In the central government sector, while there has been an improvement in the number of management letters issued on time in the government department and tertiary education institution sectors, it is disappointing not to see an improvement in performance in other sectors. This is clearly an area that needs improvement, and we will work with appointed auditors to ensure that they fulfil their reporting obligations in a timely manner.
Consistent with the improvement in audits completed within statutory timeframes, there has also been an improvement in the percentage of management reports issued to public entities within six weeks in the local government sector. Again, this is a reflection of resources being diverted in prior years to the triennial audit of LTCCPs. We see this area as one that needs improvement and we will continue to follow this up with our auditors.
Client satisfaction survey
The results of our client satisfaction survey continue to exceed our target of 75% of respondents rating service as 7 or greater on a scale of 1 to 10. The client satisfaction survey resulted in an overall satisfaction rating of 83%, compared with 80% in 2008/09 and 78% in 2007/08. We intend to continue to focus our efforts on improving those areas identified by public entities as needing to improve, including:
- improving sector knowledge and understanding across audit teams;
- improving relationships with governing bodies;
- improving lead times and timeframes for audit work;
- being competitive on costs, particularly for smaller entities; and
- minimising the effect of staff turnover.
Quality assurance reviews
Our quality assurance reviews of appointed auditors continue to show generally pleasing results. Of those auditors subject to quality assurance review during the year, 98% achieved a grade of "satisfactory" or better against our target of 95%.
We will continue to focus on raising the general quality of audits performed on behalf of the Auditor-General.
Independent review of audit allocation and fee setting and monitoring
Our independent reviewer has again assessed our audit allocation and fee-setting and monitoring systems (the full report is included at pages 40-43). The reviewer concluded that the processes for allocating audits in the public sector and for setting fees in the financial year to 30 June 2010 have been carried out with due probity and objectivity.
During 2010/11, we intend to carry out a comprehensive review of the allocation of audits among the Auditor-General's audit service providers, including Audit New Zealand. We expect that this will result in some audits being reallocated between audit service providers. Where a change is proposed, we will consult with those public entities affected.
Audit fees
There continues to be pressure on audit fees. During 2009/10, fees for all types of audits continued to be affected by the residual and ongoing costs associated with changes in auditing and financial reporting standards (including NZ IFRS), in addition to the entity-specific issues that affect fees.
Figure 10 summarises the movements in audit fees from 2008/09 to 2009/10, based on those audit fees that had been agreed at the time when the analysis was prepared. It shows the movement by sector in both the hours and the average hourly cost of carrying out audits in the public sector.
Figure 10
Analysis of movements in audit fees
| 2008/09 to 2009/10 | 2007/08 to 2008/09 | |||||||
|---|---|---|---|---|---|---|---|---|
| Number of entities | Increase in total fee | Due to hours | Due to charge-out rate | Number of entities | Increase in total fee | Due to hours | Due to charge-out rate | |
| Government departments | 34 | 1.7% | 3.3% | -1.6% | 40 | 6.7% | 1.9% | 4.8% |
| State-owned enterprises | 10 | 1.7% | -1.0% | 2.8% | 19 | 14.5% | 7.6% | 6.9% |
| Crown entities | 54 | 6.8% | 7.7% | -0.9% | 70 | 10.4% | 4.7% | 5.7% |
| District health boards | 14 | 3.9% | 0.9% | 3.0% | 21 | 7.2% | 7.2% | 0.0% |
| Crown Research Institutes | 6 | 4.1% | 3.6% | 0.6% | 9 | 16.3% | 4.8% | 11.5% |
| Tertiary education institutions | 20 | 10.1% | 10.0% | 0.1% | 26 | 3.4% | 12.6% | -9.2% |
| Energy companies | 21 | 3.2% | -0.1% | 3.2% | 23 | 20.1% | 6.6% | 13.5% |
| Local authorities | 69 | 6.0% | 8.2% | -2.2% | 91 | 5.9% | 7.1% | -1.2% |
| Local government subsidiaries | 149 | 9.2% | 7.4% | 1.8% | 192 | 10.3% | 11.0% | -0.7% |
| Port companies | 10 | 5.2% | 2.2% | 3.0% | 11 | -0.8% | 6.0% | -6.8% |
| Licensing and community trusts | 16 | 4.8% | 1.8% | 3.0% | 16 | 7.3% | -5.8% | 13.1% |
| Māori Trust Boards | 6 | 7.6% | 9.1% | -1.5% | 6 | 11.3% | 0.8% | 10.5% |
| Schools | 2446 | 7.6% | 4.8% | 2.8% | 2445 | 0.6% | -2.6% | 3.2% |
| Other | 172 | 7.5% | 4.4% | 3.1% | 74 | 4.0% | 1.2% | 2.8% |
| Total | 3027 | 5.8% | 5.1% | 0.7% | 3043 | 6.7% | 3.4% | 3.3% |
Notes:
1. Movements in total audit fees comprise movements in audit hours and movements in charge-out rates of staff engaged on the audits.
2. Fee movements are based on those of entities with balance dates falling within the financial year of the Office (for example, fees for the 31 December 2009 audits of schools are included in the 2009/10 year).
Figure 11
Financial performance of output class: Audit and assurance services
| 2009/10 | 2009/10 | 2008/09 | 2007/08 | |
|---|---|---|---|---|
| Actual | Supp. Estimates | Actual | Actual | |
| $000 | $000 | $000 | $000 | |
| Income | ||||
| Crown | 150 | 150 | 150 | 150 |
| Other | 63,939 | 62,955 | 60,483 | 58,505 |
| Expenditure | (62,736) | (63,087) | (60,602) | (58,624) |
| Surplus/(Deficit) | 1,353 | 18 | 31 | 31 |
Supporting accountability to Parliament
This output class includes two outputs:
- Parliamentary services – providing advice and assistance to select committees and other stakeholders; and
- Controller function – carrying out the Controller function.
Advice and assistance
Through our annual audits, performance audits, and inquiries, the Auditor-General has a broad overview of public entities – individually and throughout sectors. Through our services to Parliament, we provide advice and assistance to select committees, Ministers, and individual members of Parliament, as well as to central agencies and other public sector representative groups, to assist them in their work to improve the performance and accountability of public entities.
The main ways in which we provide this advice and assistance are:
- reports and advice to select committees to assist their financial reviews of government departments, Crown entities, and State-owned enterprises;
- reports and advice to select committees to assist their examination of the Estimates of Appropriations; and
- reports to responsible Ministers on the results of the annual audits.
We also provide advice and assistance through:
- reports to Parliament and other constituencies on matters arising from our annual audits (including presenting two reports to Parliament on the results of our audits in central and local government);
- responding to requests and participating in working parties on matters related to financial management and accountability with other stakeholders, including central agencies, government departments, local authorities, professional bodies, sector organisations, and other public entities; and
- working with Auditors-General in other countries to encourage, promote, and advance co-operation in the field of public audit. This includes our role as Secretariat of the Pacific Association of Supreme Audit Institutions, being a member of various committees of the International Organisation of Supreme Audit Institutions, and being executing agent for the Pacific Regional Audit Initiative (funded by the Asian Development Bank, with co-financing from the Japan Special Fund and the Government of Australia).
Measuring our performance for output: Parliamentary services
Figure 12
Actual performance against impact measure and standard for output: Parliamentary services
| 2009/10 forecast main impact measure and standard | 2009/10 Actual |
2008/09 Actual |
2007/08 Actual |
|---|---|---|---|
| Select committees confirm that the Office's advice assists them in Estimates of Appropriations and financial review examinations. | 100% of respondents rated us as 4 or better on a scale of 1 to 5 as assessed through our stakeholder feedback interviews. | 100% of respondents rated us as 4 or better on a scale of 1 to 5 as assessed through our stakeholder feedback interviews. | 100% of respondents rated us as 4 or better on a scale of 1 to 5 as assessed through our stakeholder feedback interviews. |
Figure 13
Stakeholder feedback on Parliamentary services impact
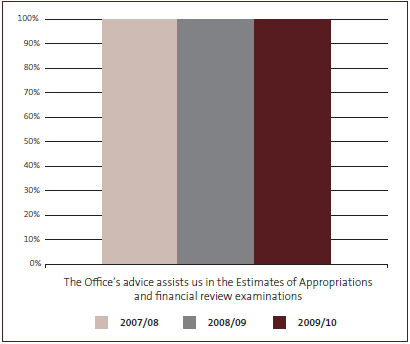
Figure 14
Actual performance against output delivery measures and standards for output: Parliamentary services
| 2009/10 forecast measures and standards of output delivery | 2009/10 Actual |
2008/09 Actual |
2007/08 Actual |
|---|---|---|---|
| Reports and advice are given to select committees and Ministers at least two days before an examination, unless otherwise agreed. | 100% | 100% | 100% |
| An internal review of a sample of financial review, Estimates, and Ministerial reports confirms that they meet relevant standards and procedures, including that reports are consistent in their framework and approach and are peer reviewed in draft. (The nature, extent, and frequency of the quality assurance review are determined based on risk. The review is carried out during a three-year period.) | There was no internal review this year. | There was no internal review this year. | Confirmed by internal review of a sample of reports. |
| At least 85% of select committee members we seek feedback from rate the advice they receive from us as 4 or better on a scale of 1 to 5 for: | |||
|
86% 86% |
86% 86% |
80% 83% |
| At least 85% of other stakeholders we seek feedback from rate the advice they receive from us as 4 or better on a scale of 1 to 5 for relevance and usefulness. | 100% | 100% | 100% |
Figure 15
Stakeholder feedback on Parliamentary services outputs
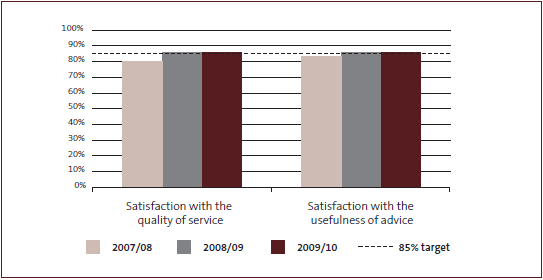
To assess the relevance, value, and timeliness of our advice and assistance to select committees, and other stakeholders, we commission independent stakeholder feedback interviews (conducted for 2009/10 in June 2010). Stakeholder ratings for the quality and usefulness of advice to select committees remained at 86% and above our target of 85% of select committee members rating our advice as 4 or better on a scale of 1 to 5 (see Figures 14 and 15).
Our measure of the extent to which our advice assists select committee members in their Estimates examinations and financial reviews has remained the same as last year – with all stakeholders who provided feedback rating us as 4 or better on a scale of 1 to 5 (see Figures 12 and 13). The stakeholder feedback report noted that the results show that the Office is continuing to perform at a high level, and that stakeholders value the professional, impartial advice and guidance they receive from the Office.
The report recommended that the Office assess the improvements suggested, but noted that:
… stakeholders commented that, while they were happy to suggest improvements, these were minor compared with their overall satisfaction and respect for the Office and the quality of its work.
Ninety per cent of stakeholders also agreed that our staff have an excellent understanding of their sectors, and all select committee members agreed that the Office was proactive in alerting the committee to significant issues. All select committee members also agreed that the Office's work helps build and maintain public trust in the effectiveness and efficiency of the public sector.
The Auditor-General visited all select committee chairpersons soon after her appointment and received similar feedback about what select committees value about the work we do for Parliament. Suggestions for improvement provided to the Auditor-General were similar to those reflected in the stakeholder feedback interviews (discussed below).
The results of the stakeholder feedback study are pleasing, as they show that the Office plays an important part in supporting accountability to Parliament. It is also pleasing that we have sustained these results when there continues to be an increase in the number of advisory reports we provide to Parliament.
The improvements suggested by stakeholders include encouraging the Office to look for ways to provide benchmarking information in its advice, being clear about the significance of issues, making the oral presentations shorter and sharper, and considering how the Office can play a greater part in the financial review process. Select committees also recognise that the Office has to maintain its independence while carrying out its advisory role.
In 2010/11, we are planning to review the various advisory products we prepare for select committees to ensure that the reports are targeted, relevant, and useful, and that we continue to play our part to the fullest extent in helping Parliament hold the Executive to account.
Controller function
The Controller function of the Controller and Auditor-General provides independent assurance to Parliament that expenses and capital expenditure of departments and Offices of Parliament have been incurred for purposes that are lawful, and within the scope, amount, and period of the appropriation or other authority.
The OAG and appointed auditors carry out standard operating procedures to give effect to the Controller function in keeping with the Auditor-General's auditing standards and the Memorandum of Understanding with the Treasury. This involves reviewing the monthly reports provided by the Treasury, and advising the Treasury of any issues arising and the action to be taken.
Each year, we report to Parliament on the significant issues arising from operation of the Controller function.
Measuring our performance for output: Controller function
Figure 16
Actual performance against impact measure and standard for output: Controller function
| 2009/10 forecast main impact measure and standard | 2009/10 Actual |
2008/09 Actual |
2007/08 Actual |
|---|---|---|---|
| Expenses and capital expenditure of departments and Offices of Parliament are incurred for purposes that are lawful and within the scope, amount, and period of the appropriation or other authority. Where there is a breach or suspected breach, actions are taken in accordance with the Auditor-General's powers and auditing standards, and the Memorandum of Understanding with the Treasury. | The operation of the monthly Controller process and the appropriation audit were carried out to ensure that this measure was achieved. | The operation of the monthly Controller process and the appropriation audit were carried out to ensure that this measure was achieved. | The operation of the monthly Controller process and the appropriation audit were carried out to ensure that this measure was achieved. |
In 2008/09, there were 39 instances of unauthorised expenditure amounting to more than $927 million. This was an increase in both number and value of such instances from the previous year (32 instances amounting to $567 million) but represents only a small part of total government expenditure during the year. However, unauthorised expenditure is always a concern, and we continue to emphasise the need for departments to pay closer attention to ensure that they have authority before incurring expenditure.
The final figures for the 2009/10 year are not yet available, but the information from the monthly Controller reports indicates a pattern consistent to last year.
Figure 17
Actual performance against output delivery measures and standards for output: Controller function
| 2009/10 forecast measures and standards of output delivery | 2009/10 | 2008/09 | 2007/08 |
|---|---|---|---|
| Monthly statements provided by the Treasury are reviewed for the period September to June inclusive. Advice of issues arising and action to be taken is provided to the Treasury and appointed auditors within five working days of receipt of the statement. | All monthly procedures have been followed, and agreed time frames achieved. | All monthly procedures have been followed, and agreed time frames achieved. | All monthly procedures have been followed, and agreed time frames achieved. |
| Internal quality assurance is conducted to gain assurance that our policies, procedures, and standards in relation to the Controller function have been applied appropriately. | Review to be carried out in the first quarter of 2011/12, at the end of Controller function work for 2010/11. | An internal review was carried out in May 2009, which confirmed the central work carried out was consistent with the Memorandum of Understanding and that the monthly processes operated effectively. There was considerable improvement in the appropriation audit approach and documentation to demonstrate compliance with the auditing standard. | Review to be carried out in the first quarter of 2008/09, at the end of Controller function work for 2007/08. |
Figure 18
Financial performance of output class: Supporting accountability to Parliament
| 2009/10 | 2009/10 | 2008/09 | 2007/08 | |
|---|---|---|---|---|
| Actual | Supp. Estimates | Actual | Actual | |
| $000 | $000 | $000 | $000 | |
| Income | ||||
| Crown | 3,122 | 3,122 | 3,176 | 3,064 |
| Other | 0 | 0 | 7 | 6 |
| Expenditure | (3,004) | ( 3,122) | (3,173) | (3,014) |
| Surplus/(Deficit) | 118 | 0 | 10 | 56 |
Performance audits and inquiries
This output class includes two outputs:
- Performance audits – reporting to Parliament and other constituencies on matters arising from performance audits and other studies, including good practice guides; and
- Inquiries – carrying out, and reporting on, inquiries relating to central and local government entities.
Performance audits, other studies and inquiries
The Public Audit Act 2001 provides the Auditor-General with the discretion to carry out performance audits, other studies, and inquiries to examine matters concerning a public entity's use of resources, including:
- the extent to which activities are carried out effectively and efficiently;
- compliance with statutory obligations;
- any acts or omissions to determine whether waste has resulted or may result; and
- any act or omission showing or appearing to show a lack of probity or financial prudence by a public entity or its members, office holders, or employees.
The Auditor-General must also respond to requests for approvals in relation to pecuniary interest questions regulated by the Local Authorities (Members' Interests) Act 1968.
Performance audits, other studies, and inquiries allow the Auditor-General to consider and provide advice about issues of accountability, performance, waste, probity, and authority in greater depth than is appropriate within the statutory scope of an annual audit. Other studies include good practice guides and discussion papers.
Effective, efficient, and accountable public entities that operate within their authority and according to high ethical standards are the foundation for trust in the public sector. Therefore, the intended impacts of the appropriation are as shown in Figure 19.
Measuring our performance for output: Performance audits
Figure 19
Actual performance against impact measure and standard for output: Performance audits
| 2009/10 forecast main impact measure and standard | 2009/10 Actual |
2008/09 Actual |
2007/08 Actual |
|---|---|---|---|
| Entities accept or respond to the recommendations made in our performance audits, as assessed by internal review of the reports of performance audits published in the previous calendar year. Results of this review are presented to the Officers of Parliament Committee. | The actions taken by entities in response to the findings of 12 performance audits we completed in 2008 were reported to Parliament in April 2010. Our recommendations, and the entities' responses to them, had contributed to improvements in:
|
Three performance audit reports were selected by our Audit and Risk Committee for review, and the results were presented to the Officers of Parliament Committee. The review concluded that our recommendations had been accepted by the relevant entities and either had been implemented or were being implemented. | Three performance audit reports were selected by our Audit and Risk Committee for review, and the results were presented to the Officers of Parliament Committee. The review concluded that our recommendations had been accepted by the relevant entities and either had been implemented or were being implemented. |
Performance audits and other studies
A performance audit is a significant and in-depth audit covering issues of effectiveness and efficiency. It provides Parliament with assurance about specific issues or programmes and how well these are managed by the relevant public entity or entities. We also do other studies that may result in published good practice guidance on topical issues of public sector accountability and performance to assist public entities to better manage these issues.
Core areas of interest for the Auditor-General include:
- major public investment or liability management (focusing on the New Zealand Debt Management Office, Accident Compensation Corporation, New Zealand Superannuation Fund, Government Superannuation Fund, Earthquake Commission, and Student Loans Scheme);
- major public revenue management or generation (focusing on the Inland Revenue Department and New Zealand Customs Service);
- major asset management or infrastructure spending or management (focusing on health, correctional facilities, education, defence, conservation, transport, housing, and energy);
- major public expenditure, including service delivery expenditure (focusing on health, education, and social security and welfare); and
- local government (focusing on major asset management, infrastructure expenditure, delivery of services, and amalgamation of the Auckland councils).
Results of major and significant inquiries are also often reported to Parliament.
Figure 20
Actual performance against output delivery measures and standards for output: Performance audits
| 2009/10 forecast measures and standards of output delivery | 2009/10 Actual |
2008/09 Actual |
2007/08 Actual |
|---|---|---|---|
| We complete 19 to 21 reports on matters arising from performance audits and other studies, and inquiries. | 20 | 19 | 22 |
| Select committees and other stakeholders are satisfied with the proposed work programme of performance audits (as indicated by feedback on our draft annual work programme). | We sought feedback on our proposed 2010/11 work programme under section 36(1) of the Public Audit Act 2001. The feedback mainly supported the proposals we made and the approach we had taken in determining the proposed work programme. |
We sought feedback on our proposed 2009/10 work programme on two occasions under section 36(1) of the Public Audit Act 2001. The feedback mainly supported the approach we had taken to determining the proposed work programme. |
We sought feedback on two occasions under section 36(1) of the Public Audit Act 2001. The feedback mainly supported the approach we had taken to the proposed work programme and gave us guidance on the scope and relative emphasis we should place on one or two key studies. |
| At least 85% of the stakeholders that we seek feedback from rate our performance audit reports (relevant to their sector or interest) as 4 or better on a scale of 1 to 5 for: | |||
|
80% 100% |
100% 67% |
50% 66% |
| Our performance audit methodology reflects good practice for carrying out such audits, as assessed every second year by the Australian National Audit Office. | N/A | The Australian National Audit Office reviewed two performance audits and confirmed areas in which the quality of our reports is strong and areas for us to improve. | N/A |
Reports on performance audits, other studies, and major inquiries completed during 2009/10
In 2009/10, we completed 20 reports on matters arising from performance audits, other studies, and major inquiries. Since we set the target of completing 19 to 21 reports each year, we are very pleased to have consistently achieved this. Each of the reports that we complete is unique and requires a different level of time and resource, so the number of reports that we produce can be expected to fluctuate from year to year. The reports we completed during 2009/10 are listed in Figure 21. Appendix 1 on pages 115-125 summarises each of these reports. Copies of published reports are available on our website: www.oag.govt.nz.
Figure 21
Performance audits, other studies, and major inquiries completed in 2009/10
Performance audits and other studies from our 2009/10 annual plan:
|
Performance audits, other studies, and major inquiries under way during 2009/10
In addition to those reports completed during 2009/10, we had work on 25 performance audits, other studies, and major inquiries at various stages of completion at the end of the year.
Progress with completion of our 2009/10 annual plan
On pages 69-75 of our Annual Plan 2009/10, we listed the performance audits and other studies that we proposed to conduct in 2009/10. Our actual work programme varies from that planned in response to changing priorities, such as urgent work on new inquiries, and changes in government policy or entity circumstances affecting the timing or relevance of audits. Figure 22 shows the progress we have made in completing the proposed work programme set out in our 2009/10 Annual Plan.
Figure 22
Progress with completion of our 2009/10 annual plan
Performance audits and other studies completed during 2009/10:
|
Performance audits and other studies under way during 2009/10 and due to be completed in 2010/11:
|
Performance audits and other studies due to be started in 2010/11 or later:
|
Performance audits and other studies cancelled:
|
The relevance and usefulness of our work programme
We consult select committees and other stakeholders on our proposed annual work programme. Consultation with Parliament helps us to ensure that the work we do is relevant and useful to Parliament, public entities, and the public. The feedback we received this year on our proposed 2010/11 work programme mainly supported the proposals we had made and the approach we had taken in determining the proposed work programme, with a specific suggestion made for future years being the performance of the New Zealand Police in road safety enforcement.
We are aware that the wider environment is one of rapid change influenced by the economic conditions we are currently experiencing, which in turn changes the priorities of the Government. In this wider environment, we will consider amending specific proposals or substituting other work should the need arise.
The strength of our methodology
Every second year, our performance audit methodology is assessed by the Australian National Audit Office. The Australian National Audit Office last reviewed two of our performance audits in 2008/09, and their next review is scheduled for 2010/11.
We also conduct internal quality assurance reviews on selected performance audit reports to confirm that reports are prepared in keeping with our performance audit methodology. The nature, extent, and frequency of the quality assurance review are based on risk, and the review is carried out during a three-year period. The last internal review, in 2007/08, confirmed that appropriate systems and controls were in place and that reports were prepared in keeping with our performance audit methodology.
The quality and usefulness of our reports
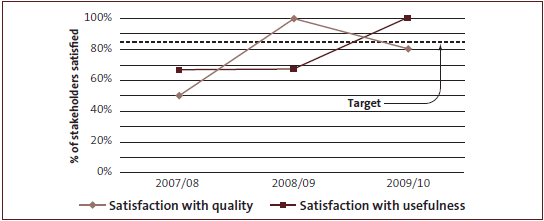
Each year, we seek the views of a small sample of select committee chairpersons, deputy chairpersons, and other stakeholders on the quality and usefulness of the performance audit reports that we have published. A summary of our performance in the last three years against our target for stakeholder satisfaction with the quality and usefulness of our performance audit reports is shown in Figure 23.
For 2009/10, we are pleased that all of the stakeholders we surveyed rated the usefulness of our performance audits highly, an increase from the previous two years and exceeding our target. The proportion of stakeholders rating the quality of our performance audit reports highly has fluctuated over the last three years and dropped to 80% in 2009/10 from 100% the year before, falling below our target of 85%. One person thought that we could make our recommendations more succinct and identify which were the priorities.
Figure 23
Stakeholder satisfaction with the quality and usefulness of our reports
Each year, we also have two of our performance audit reports independently reviewed to assess the quality of the reports in terms of: the presentation of administrative and management context; report structure, presentation, and format (including use of graphics and statistics); and the reasonableness of the methodology used and the resulting conclusions and recommendations. For 2009/10, strengths of our reports identified by the reviewers included:
- a logical, clear, and concise structure and writing style;
- an executive summary covering the main messages; and
- clear and informative conclusions supported by the evidence.
There were some common themes identified by the reviewers for how we could improve the quality and usefulness of our reports and comments from some of our stakeholders that were surveyed. We will take action on the feedback from our stakeholders and the suggestions of our independent reviewers. Both pointed to the scope for our reports to be more analytical and sharper in their findings – for example, through:
- presenting more data in graphs and tables and other graphics where relevant; and
- including entity financial reporting information, resource statistics, and performance indicators to provide more information on the context the entity is operating in.
We are committed to adding value through insightful assessment of the effectiveness and efficiency of the activities we report on and to continuously strengthening the depth and relevance of our performance audits and other studies. As we continue to sharpen our approach, this will be reflected in the methods we use, the size of our reports, how we resource them, and how many we produce.
Inquiries
Inquiries allow the Auditor-General to investigate in detail particular issues of concern with the activities of public entities. In many cases, inquiries will result in assurance to the organisation or the public that the organisation has managed a situation appropriately. In some cases, a public report on an inquiry will enable accountability for failures within an organisation and draw attention to the need for improvements.
Inquiries can be large or small, and cover a wide range of issues. We can carry out inquiries on our own initiative or when correspondence from the public draws attention to potential issues. Each year, we usually receive:
- 200 to 300 external requests for inquiries; and
- 50 to 100 enquiries under the Local Authorities (Members' Interests) Act.
The Auditor-General has discretion about which matters to inquire into. Our resources are also limited. We therefore choose carefully which requests for inquiries we follow up with in-depth investigation and reporting. We do not see the Auditor-General's office as an avenue for resolving individual complaints or concerns about how a public entity has handled a particular matter. As the auditor of these entities, our focus is on financial and organisational matters.
We examine requests and carry out preliminary work to identify whether the issues raised suggest financial impropriety, problems with the organisation's overall governance and management, or other systemic or significant concerns that may be important for the organisation or the sector, or may be of general public interest.
We classify inquiries into three categories – routine, sensitive, and major – depending on how serious the issues raised are. A routine inquiry involves straightforward issues, and can often be carried out either by a review of documents or through correspondence and discussion with the public entity. It will not usually result in a published report. We always advise the correspondent of our conclusions and the reasons for them, and in some instances we advise the public entity of the matter.
Sensitive and major inquiries involve more complex issues and may attract a broader level of public interest and attention. In these inquiries, we will often review the public entity's files and may also formally interview people. We may report the results of these inquiries publicly, as well as advising the correspondent of the results of our work.
Figure 24
Actual performance against impact measure and standard for output: Inquiries
| 2009/10 forecast main impact measure and standard | 2009/10 Actual |
2008/09 Actual |
2007/08 Actual |
|---|---|---|---|
| Entities take action in response to concerns identified in inquiry reports, as assessed by follow-up on a sample of sensitive and major inquiries undertaken in the previous year. | We followed up on four of the 13 inquiries within these categories from the previous year that contained recommendations or suggestions for action. Where we focused on a particular entity and particular problems, we saw a high acceptance of our views and comments, contributing to significant change in the relevant entities. Two less significant comments had received an adequate response. |
We followed up on four of the 11 inquiries within these categories from the previous year that contained recommendations or suggestions for action. In all cases, we were satisfied with the action taken. | We have followed up the one sensitive inquiry that was carried out in 2006/07 (there were no major inquiries). The entity has taken positive steps to address the comments we made. |
Measuring our performance for output: Inquiries
Figure 25
Actual performance against output delivery measures and standards for output: Inquiries
| 2009/10 forecast measures and standards of output delivery | 2009/10 Actual |
2008/09 Actual |
2007/08 Actual |
|---|---|---|---|
| 80% of our findings on inquiries are reported to the relevant parties within: | |||
|
86% (182 routine inquiries, 157 reported within three months) | 84% (99 routine inquiries, 83 reported within three months) | 91% (115 routine inquiries, 105 reported within three months) |
|
94% (16 sensitive inquiries, 15 reported within six months) | 73% (11 sensitive inquiries, eight reported within six months) | 82% (11 sensitive inquiries, nine reported within six months) |
|
80% (five major inquiries, four reported within 12 months) | 0% (two major inquiries, both reported within 13 months) | No major inquiries were carried out |
| We complete 80% of enquiries under the Local Authorities (Members' Interests) Act 1968 within 30 working days. | 85% (80 completed, 68 within 30 working days) | 87% (53 received, 46 reported within 30 working days) | 95% (103 received, 98 reported within 30 working days) |
| Responses to requests for inquiries, and our administering of the Local Authorities (Members' Interests) Act 1968 requests, are in accordance with relevant policies, procedures, and standards, as confirmed by internal quality assurance review. (The nature, extent, and frequency of the quality assurance review are determined based on risk. The review is carried out during a three-year period.) |
No internal quality assurance review was undertaken in 2009/10. | No internal quality assurance review was undertaken in 2008/09. | Review was completed and confirmed that requests are undertaken in accordance with relevant policies, procedures, and standards. |
Last year, we reported that we were receiving a higher number of requests, and that the issues we were being asked to examine were more complex. In particular, the demand for us to carry out inquiries that we classified as major or sensitive was growing. We noted that the increased pressure on our inquiries workload was starting to have an effect on our performance and in particular our timeliness in completing inquiries. Figure 26 shows the number of requests, analysed according to the category of inquiry.
Figure 26
Summary of requests for inquiries dealt with during 2009/10
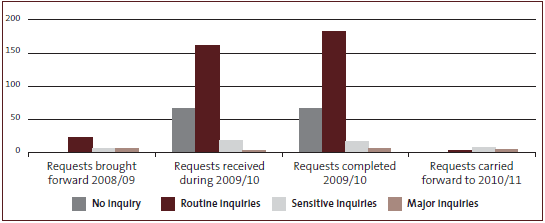
That pattern of growth in demand for inquiries has continued this year, up from 307 in 2008/09 to 349 in 2009/10. In 2007/08 there were 116 requests deemed as no inquiries, in 2008/09 142 requests were deemed as no inquiries, and in 2009/10 there were 66 requests deemed as no inquiries. We began the year with 11 sensitive or major inquiries under way, and added another 20 to those during the year. At the end of June 2010, we had completed 21 of these. Two more major inquiries were in their final publication stages at the end of the year. The number of routine inquiries, as opposed to matters that we can conclude almost immediately, has also increased.
The major inquiries that we completed or worked on during the year were:
- Inquiry into how the Ministry of Education managed the 2008 national school bus transport tender process (published October 2009);
- Auditor-General's decision on parliamentary and ministerial accommodation entitlements (published October 2009);
- Auckland Regional Council: Management of the LA Galaxy event at Mount Smart Stadium (published January 2010);
- Auckland City Council: Management of footpaths contracts (published February 2010);
- Auditor-General's inquiry into certain types of expenditure in Vote Ministerial Services – Part 1 (published March 2010);
- Inquiry into New Zealand Defence Force payments to officers seconded to the United Nations (published July 2010);
- Inquiry into the Plumbers, Gasfitters, and Drainlayers Board (published August 2010); and
- Inquiry into Vote Ministerial Services expenditure – Part 2 (departmental systems) (publication pending).
As we discuss below, we also completed and published a major investigation under the Local Authorities (Members' Interests) Act 1968 into the participation of Environment Canterbury councillors in council decisions when they had a pecuniary interest in those decisions.
Given that major inquiries, particularly those in the political sphere, require the involvement of senior staff, there have been flow-on effects on other parts of our work. However, it is pleasing that we have managed to maintain the flow of routine inquiry work.
Throughout the year, we have also been working on changes to the way in which we resource and manage our inquiries work. The key goals are to:
- streamline straightforward processes where we can;
- be clearer and more consistent on which issues warrant inquiry by us; and
- improve our timeliness in providing responses and reports.
In the coming year, we will be updating the information we make publicly available about this part of our work, to explain more fully the types of issues that we can usefully inquire into, and what people can expect from the Office.
Enquiries under the Local Authorities (Members' Interests) Act 1968
We also administer the Local Authorities (Members' Interests) Act 1968 (the Act), which governs the financial interests of members of local authorities. The number of enquiries that we dealt with during the year, and our timeliness in responding, are set out in Figure 26 above.
The main feature of the year in this work was our investigation into the participation of councillors in decisions taken by Environment Canterbury on changes to the charging regime for water consents, when they had a pecuniary interest in those decisions. This investigation attracted significant public interest, at a time when Environment Canterbury's work and future role were politically controversial. We published a report on our investigation in December 2009.3 In it, we explained our conclusion that the four affected councillors had all breached the Act by participating, but that it would not be appropriate to prosecute them for that breach. We noted that this was the type of situation where we would have considered approving their participation, if they had realised in advance that they could not participate and had applied to us.
For the further council decisions that followed on the charging regime, the councillors applied for approval to participate. We approved their participation, except for one major decision where we concluded that one councillor's interest was too substantial for her participation to be appropriate.
We are aware that this set of events created some confusion in the sector and some concern about the potential scope of section 6 of the Act. Many councillors and council staff have approached us for advice or approvals on a range of situations in recent months. As a result, we have recently published a substantial discussion of our work under this Act, and the Environment Canterbury analysis, to provide the sector with further guidance.4
In that recent publication, we also reiterated our concern that the Act is out of date and increasingly impractical to administer. We have previously suggested that the contracting rule in section 3 of the Act achieved little, but added compliance cost and risk to the sector. We had suggested that this rule should be repealed, but that the participation rule in section 6 had merit. However, developments over the last two years now suggest that this rule is also becoming difficult to operate in practice. The Environment Canterbury decision, and the uncertainty that has followed, illustrate its problems. We have therefore suggested that the Act needs to be reviewed as a whole, from first principles, to assess whether it is still relevant or appropriate.
The Auditor-General and the President of Local Government New Zealand have recently written a joint letter to the Minister of Local Government, voicing their concerns about the Act.
We realise that any legislative reform would take some time. We are therefore continuing to administer the Act in a practical way, and to provide advice and guidance to those affected by it. Our experience is that the number of requests for advice or approvals under the Act increases at the time of the local authority elections, as candidates and new members seek to clarify their situations.
Figure 27
Financial performance of output class: Performance audits and inquiries
| 2009/10 | 2009/10 | 2008/09 | 2007/08 | |
|---|---|---|---|---|
| Actual | Supp. Estimates | Actual | Actual | |
| $000 | $000 | $000 | $000 | |
| Income | ||||
| Crown | 6,587 | 6,587 | 6,587 | 6,407 |
| Other | 0 | 0 | 17 | 14 |
| Expenditure | (6,044) | (6,587) | (6,159) | (6,223) |
| Surplus/(Deficit) | 543 | 0 | 445 | 198 |
3: Investigation into conflicts of interest of four councillors at Environment Canterbury, available on our website www.oag.govt.nz.
4: Controller and Auditor-General, Local government: Results of the 2008/09 audits, Part 9, June 2010.
page top
