Part 3: About the Manawatu-Wanganui and Otago regions
- The Manawatu-Wanganui region
- The Otago region
- Regional Council planning documents
- Timeline for preparation of planning documents
The Manawatu-Wanganui region
3.1
The Horizons Regional Council oversees the Manawatu-Wanganui region – the sixthlargest region in New Zealand, accounting for 8.1% of the country’s total land area.
3.2
More than half of the region’s population of 220,440 live in the urban centres of Palmerston North and Wanganui. The remainder live in small rural communities throughout the region.
3.3
Agriculture has been at the core of the region’s economy since European settlement. In some rural districts, more than 25% of the population is employed in the agricultural sector.
3.4
The region has the greatest total area and percentage (61%) of hill country in New Zealand. Most of this is vulnerable to erosion, and accounts for 11 million tonnes of sediment entering rivers each year.
3.5
The region also has the highest percentage of pasture (61%). Soils on the plains and terraces are under intensive primary production pressure.
3.6
The region has 3 river systems – the Whanganui, the Manawatu, and the Rangitikei.
3.7
For the purposes of this report we have selected the Manawatu River as a water quality example and the Rangitikei River as a water quantity example.
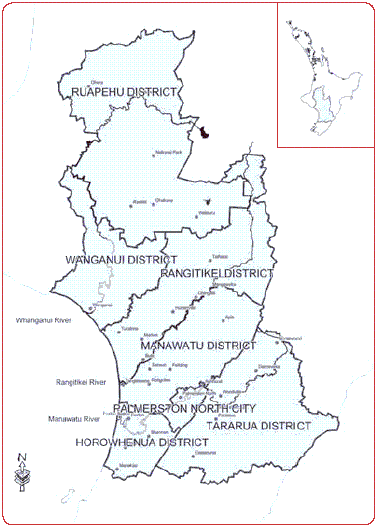
Figure 4
Map of the Manawatu-Wanganui region

Water quality
3.8
Surface water quality is affected by agricultural activity and by activities in towns and cities (particularly by stormwater and wastewater treatment plant discharges).
3.9
Three-quarters of the region’s dairy shed discharges and half of the community sewage discharges to water are into the Manawatu catchment. The Manawatu River downstream from Palmerston North has one of the highest disease risks for swimmers in the region, and suffers from growths of periphyton (green slime) during low flow periods. Swimming below municipal sewage discharges on a number of rivers is not recommended.
3.10
In some parts of the region, most deep, confined groundwater meets drinking water quality standards. However, high nitrate levels in other parts pose a health risk for the rural populations that depend on groundwater for drinking water.
Water quantity
3.11
The region’s temperate climate supplies ample rainfall to ensure a good flow of water in most rivers and streams, although flows in late summer and autumn can be low.
3.12
Irrigation needs in lowland areas are driving an increased demand for water from rivers – and demand for water is highest when flows are low. The demand for groundwater has also increased because of the greater intensity of land use, and large takes of groundwater in coastal areas increase the risk of contamination by saltwater.
3.13
The Oroua River (a tributary to the Manawatu River) is already fully allocated (meaning that no more water is available to resource users). Throughout the region, the number of resource consent applications to take water, and the size of the individual takes (particularly from the upper Manawatu and lower Rangitikei rivers), has increased since 2000. Some irrigation takes are now larger than the takes for a typical small town.
Community expectations
3.14
We asked stakeholders in the region what they expected of the management of freshwater. They told us that water quality should at least not be in decline, and that they wanted clean water for recreation (including swimming, fishing, and tourism).
The Otago region
3.15
The Otago Regional Council oversees New Zealand’s second largest region, encompassing about 12% of the country’s land area.
3.16
About 63% of the Otago region’s population of 181,53915 live in the Dunedin City area. Like the Manawatu-Wanganui region, the agriculture sector has been central to the Otago region’s economy.
3.17
The Clutha and Taieri river systems are the largest in the region, both traversing long distances with large catchment areas. Other smaller, but still significant, rivers in the region include the Shag, Kakanui, and Tokomairiro.
3.18
For the purposes of this report, we have selected the Taieri River as a water quality example and the Kakanui River as a water quantity example.
Water quality
3.19
Agricultural practices, and direct discharges from industry and wastewater from sewage treatment plants, have historically led to poor water quality in some Otago rivers. Intensification of agriculture has increased degradation of water quality in some rivers, lakes, and streams.
3.20
Sub-surface drains have been installed in low-lying parts of Otago to enable farming on previously unproductive land. Where these areas have been converted to dairy farms, the drains provide a conduit for nutrient-rich dairy farm effluent to reach waterways.
3.21
At present, all of Otago’s groundwater is of useable quality.
Water quantity
3.22
Parts of Otago are very dry, with high pressure on a number of rivers and groundwater to provide for local water requirements. Small farming communities depend on limited water supplies for their livelihood.
3.23
Irrigation is an important feature of many areas of Otago, and often is critical to the continued well-being of the people and communities who rely on the primary production that it supports.
3.24
During the past 5 years, the Otago region has experienced a marked increase in the number of new dwellings built and the conversion of farms to dairying. This expansion has put pressure on a number of resources. For example, in Kakanui, there is no scope to increase the volume of water available from the Kakanui River for domestic purposes, so further development of the township is reliant on sourcing water by other means.
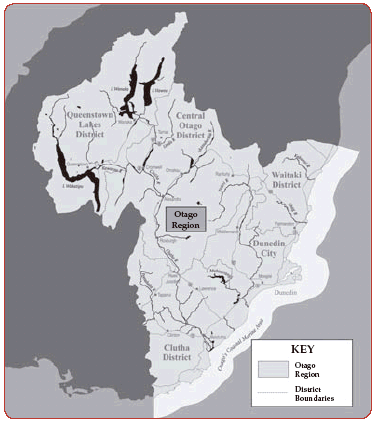
Figure 5 - Map of the Otago region

3.25
“Deemed permits”, or rights to take, dam, or discharge water complicate the management of water quantity in the Otago region. While these permits are administered under the RMA, they are historical rights granted under the Mining Act 1926 or previous mining legislation to allow property-holders rights to water.16 Deemed permits, which were originally granted in perpetuity, now expire in 2021.
3.26
Some individuals and communities depend on water provided through these permits. One farmer told us that the water provided by his mining right was more valuable to him than the property he was irrigating.
Community expectations
3.27
Stakeholders we spoke to in the region had a variety of expectations. Some expected the Otago Regional Council to provide leadership in the management of water resources. Others expected fishery habitat and water flows to achieve healthy fish stocks.
Regional Council planning documents
Horizons Regional Council
3.28
The Horizons Regional Council’s Regional Policy Statement became operative in August 1998. The Council also has 6 regional plans for the management of natural resources, and 6 non-statutory strategies that focus on transport, land, and riparian management, animal and plant pests, and management of 2 of the region’s catchments.
3.29
Our report focuses mostly on the Manawatu Catchment Water Quality Regional Plan (the Manawatu Catchment Plan), which became operative in October 1998, and the Land and Water Regional Plan, which became operative in September 2003.
3.30
We also refer to the Oroua Catchment Water Allocation and River Flows Regional Plan (the Oroua Catchment Plan), which became operative in January 1995.
3.31
The Horizons Regional Council has begun development of its second generation planning document. This will be in the form of a single plan – referred to as One Plan, which intends to integrate the Regional Policy Statement, the Regional Coastal Plan, and 5 other regional plans.
Otago Regional Council
3.32
The Otago Regional Policy Statement became operative in October 1998. The Otago Regional Council has also produced 4 regional plans. This report discusses the Otago Regional Plan: Water, which became operative in January 2004.
3.33
The Otago Regional Council also prepared catchment management strategies for Lake Tuakitoto and Lake Hayes.
Timeline for preparation of planning documents
3.34
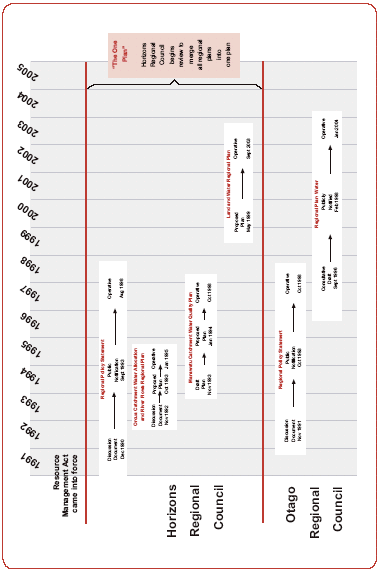
As described in paragraph 2.40, the RMA planning process involves several steps, including public consultation. Figure 6 shows the timing of preparation of the planning documents we have considered for both councils.
Figure 6
Timeline for the preparation of planning documents by Horizons and Otago Regional Councils

15: 2001 Census Data, Statistics New Zealand.
16: These rights were continued by the Water and Soil Conservation Amendment Act 1971 and section 413 of the RMA.
page top