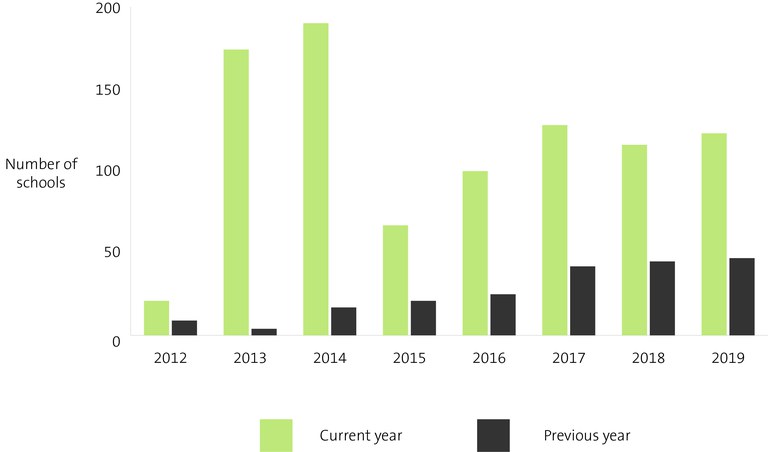
Figure 2 - Number of outstanding audits, as at 30 September, for the years 2012 to 2019
The figure shows the number of outstanding current and previous-year audits for every year since 2012. The number of outstanding audits from previous years continues to increase from 2014.
https://oag.parliament.nz/2019/school-audits/media-kit/figure2.jpg/view
https://oag.parliament.nz/2019/school-audits/media-kit/figure2.jpg/@@download/image/figure2.jpg
Figure 2 - Number of outstanding audits, as at 30 September, for the years 2012 to 2019
The figure shows the number of outstanding current and previous-year audits for every year since 2012. The number of outstanding audits from previous years continues to increase from 2014.


