Part 2: Councils' 2018-28 long-term plans and their financial results for 2017/18
2.1
We have published two reports describing the findings from our audits of the 2018-28 LTPs:
- Long-term plans: Our audits of councils' consultation documents; and
- Matters arising from our audits of the 2018-28 long-term plans.
2.2
This Part sets out the main findings from our LTP reports. It also discusses the financial position councils are in (as derived from the audited 2017/18 annual reports) at the start of the 2018-28 LTP period.1
Our audits of councils' long-term plan consultation documents
2.3
In August 2018, we published a report about our audits of councils' consultation documents for their LTPs. We considered that all of the 2018-28 consultation documents were fit for purpose. However, many of the opportunities for improvement that we described in our 2015 report on the first consultation documents had not been realised.
2.4
Consultation documents contain the matters councils are consulting on and contextual information for these matters. Achieving a balance between contextual information and the issues being consulted on is one of the challenges councils face when preparing consultation documents. Too much contextual information can make a consultation document daunting to read and limit its effectiveness.
2.5
The more effective consultation documents used plain language and were clear about the matters being consulted on. We considered that Hauraki District Council, Waimate District Council, Horowhenua District Council, and Gisborne District Council had particularly useful consultation documents.
2.6
Because communities are diverse, it is important that councils understand the different groups in their community so they can present issues and options in a way that the entire community can understand and respond to. Some councils engaged with their communities before the consultation process started – for example, by setting up informal meetings at a venue where people could drop in and speak to councillors and staff, or by running radio advertising campaigns. These councils wanted to encourage community participation and understand what their communities expected. We considered this engagement before consultation to be valuable because it increased the likelihood that people would be familiar with the important issues and the choices their council was having to make.
2.7
To provide a useful resource for the next time councils prepare and consult on their LTPs, our report on consultation documents contains a mix of commentary and good-practice guidance. We encourage councils to challenge themselves on where they can improve, both in how they produce a consultation document and the processes they use to engage with their community.
Matters arising from our audits of the 2018-28 long-term plans and councils' 2017/18 financial results
2.8
In February 2019, we published Matters arising from our audits of the 2018-28 long-term plans. All but one LTP was an effective basis for decision-making and accountability. Four matters stood out from our audits of the 2018-28 LTPs and councils' 2017/18 financial results.
Councils' forecasts for capital expenditure and debt
Capital expenditure
2.9
The 2018-28 LTPs show significant forecast capital expenditure compared with previous LTPs and what councils as a whole have previously spent. In 2017/18, councils' total capital expenditure was $4.3 billion, which was about 84% of the $5.1 billion budgeted.2 For 2018/19, councils as a whole forecast $5.7 billion on capital expenditure.
2.10
An increase in forecast capital expenditure is not new. What is new is the significant increase in the amount of forecast capital expenditure compared with previous LTPs. The increase in the forecast capital expenditure is mainly because of:
- councils' plans to meet demands arising from growth;
- new levels-of-service requirements (for example, the standards required through national policy statements); and
- the need to renew existing assets, because many assets are simply at the age where they need further investment.
2.11
The largest increases to forecast capital expenditure compared with the 2015-25 LTPs are to address the demand from growth and to improve levels of services. Renewing existing assets remains the largest category of forecast capital expenditure.
2.12
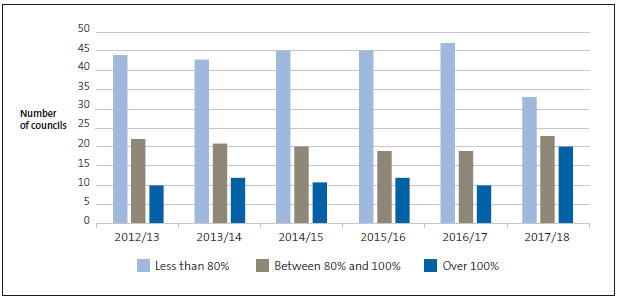
The capital expenditure forecasts included in LTPs will be challenging to achieve. Figure 1 shows that, from 2012/13 to 2016/17, most councils spent less than 80% of their capital expenditure budgets each year. Although the number of councils spending less than 80% of their capital expenditure budgets remains the largest category in 2017/18, the number of councils in that category has dropped compared with previous years.
2.13
Although it might differ for individual councils, we expect that councils will need to carefully plan, prioritise, and monitor their capital programme in 2018/19 and beyond so they can realistically achieve capital programme budgets and deliver the levels of service agreed with their communities.
Figure 1
How much councils spent of their budgeted capital expenditure, 2012/13 to 2017/18
In 2017/18, 33 councils spent less than 80% of their capital expenditure budgets. This was fewer than in previous years. For example, in 2016/17, 47 councils spent less than 80% of their capital expenditure budgets.

2.14
Most councils' capital expenditure is generally for reinvesting in their assets. When we analyse this level of expenditure, we remain concerned that councils as a whole might not be adequately reinvesting in their assets. This could result in the quality of their assets deteriorating. If councils continue to underinvest in their assets, the cost of reinvestment to regain the quality lost might fall on future generations.
2.15
To consider how councils are reinvesting in their assets, we compared renewal capital expenditure with depreciation. We consider depreciation to be the best estimate of what portion of the asset was "used up" during the financial year.
2.16
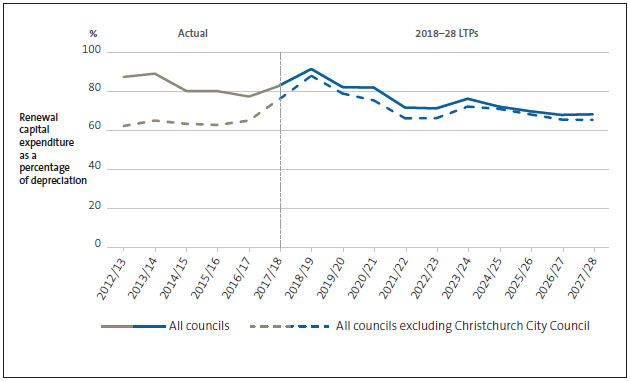
Figure 2 compares renewal capital expenditure with depreciation for all councils. This is in two distinct periods – the actual expenditure from councils' annual reports up to 2017/18 and their forecast expenditure described in the 2018-28 LTPs. There are two lines on the graph. One line includes all councils. The other, dotted line excludes Christchurch City Council. Christchurch City Council's renewal capital expenditure is proportionately higher than other councils because of the rebuilding work required as a result of the Canterbury earthquakes. Excluding Christchurch City Council gives a truer reflection of all councils' expenditure on reinvesting in their assets.
2.17
Renewals remain less than depreciation during these 16 years.
Figure 2
Renewal capital expenditure compared with depreciation for all councils, 2012/13 to 2027/28
The graph is divided into two distinct periods: the actual expenditure as described in councils' annual reports (2012/13-2017/18) and councils' forecast expenditure described in their 2018-28 LTPs (2018/19-2027/28). There are two lines on the graph. The solid line includes all councils, and the dotted line excludes Christchurch City Council. Both lines show that renewal capital expenditure is less than depreciation for the actual period from 2012/13 to 2017/18, as well as for the 10-year forecast period of the 2018-28 LTPs.

2.18
Our analysis indicates only whether the overall expenditure is enough to maintain existing assets. We urge individual councils to continue considering whether they are adequately maintaining their assets. From our audits of the 2018-28 LTPs, we found that most councils understood that they would need to plan for a renewals peak at some future stage, when renewal capital expenditure will have to exceed depreciation. Some councils still need to complete this work so they can make informed decisions about how assets will continue to be maintained in the future.
Debt
2.19
The increase in forecast capital expenditure described in councils' 2018-28 LTPs indicates that councils could face funding challenges. This is particularly so for councils that are dealing with growth in their cities or districts and are forecast to reach the debt limits that they have set (which are generally in line with the requirements of the institutions that they borrow from).
2.20
To date, councils are managing these funding challenges and debt remains within debt limits. Councils had $16.1 billion of debt at 30 June 2018. This was $0.2 billion less than what councils had budgeted and $1.2 billion more than at 30 June 2017.
Responding to climate change
2.21
Communities are already feeling the effects of climate change and that will compound the pressure of increasing capital expenditure forecasts. However, most councils are deferring making decisions about how to respond to the effects of climate change because there is too much uncertainty.
2.22
It makes little sense for all 78 councils to individually focus on the effects of climate change. In our view, there is a need for continued leadership from central and local government to deal with climate change matters. In particular, they should consider:
- what data is needed and which public organisation is going to collect that data;
- the quality required of this data; and
- how this data will be used in future planning and accountability documents, such as the LTPs.
Better understanding the performance and condition of critical assets
2.23
To support better planning, councils need to do more to better understand the performance and condition of their most critical assets. Councils generally have information about the age of their assets. However, councils also need reliable and complete information about how those assets are actually performing to ensure that they are being managed in the most efficient and effective way.
2.24
In their LTPs, many councils described the strategies they are putting in place to define what their critical assets are and then collecting the information they need. However, the issues faced by councils are becoming more complex so they need to start prioritising completing this work.
2.25
We are mindful that it takes time to collect better asset condition information. If there are gaps or weaknesses in the information, it is important that councils communicate them and their possible implications to the community. Councils should take a precautionary approach for significant services in the meantime.
The content of the long-term plans
2.26
Since the introduction of the Local Government Act 2002, there have been many changes to the process, purpose, and content of LTPs. We have supported some of these changes – such as the introduction of financial and infrastructure strategies.
2.27
However, there are some matters that are, in our view, less effective. We consider it timely for the Department of Internal Affairs and the local government sector to discuss and review the required content for LTPs to ensure that they remain fit for purpose. These less-effective matters include:
- the current suite of mandatory performance measures;
- the disclosure requirements for financial and infrastructure strategies;
- disclosures required under the Local Government (Financial Reporting and Prudence) Regulations 2014; and
- how assumptions are disclosed.
1: The 2017/18 financial information excludes the results of Hurunui District Council and Kaikōura District Council. The annual reports of these councils had not been adopted when we completed the analysis for this report.
2: This information is from the statement of cash flows of councils. It includes only the cash that councils spent on purchasing property, plant, and equipment and intangible assets. When capital expenditure, as reflected in all councils' whole-of-council funding impact statements, is compared with budget in those statements, 86% of budgeted capital expenditure has been incurred. We consider that the difference between the 84% and the 86% is because of year-end accruals.

