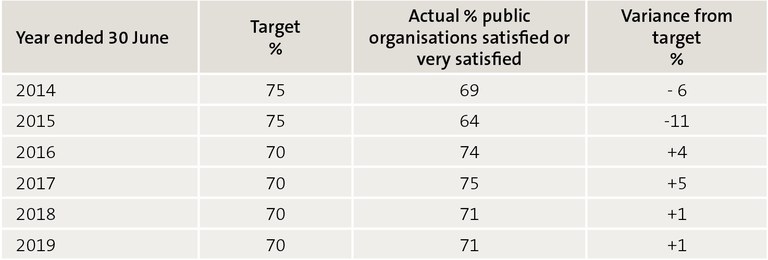
Figure 5 – Percentage of public organisations satisfied or very satisfied with all-of-government contracts, 2014 to 2019
The table shows that the target has been achieved since it was reduced from 75% to 70% in 2016. Note: In 2018/19, the survey was sent to 859 participating public organisations. NZGP received 223 valid responses – a response rate of 26%. Source: Ministry of Business, Innovation and Employment.
https://oag.parliament.nz/2019/functional-leadership/media-kit/public-orgs-satisfied-or-very-satisfied.jpg/view
https://oag.parliament.nz/2019/functional-leadership/media-kit/public-orgs-satisfied-or-very-satisfied.jpg/@@download/image/Public orgs satisfied or very satisfied.jpg
Figure 5 – Percentage of public organisations satisfied or very satisfied with all-of-government contracts, 2014 to 2019
The table shows that the target has been achieved since it was reduced from 75% to 70% in 2016. Note: In 2018/19, the survey was sent to 859 participating public organisations. NZGP received 223 valid responses – a response rate of 26%. Source: Ministry of Business, Innovation and Employment.


