Part 3: The usefulness of the financial projections
3.1
In this Part, we look at the 2016 Statement's financial projections to 2060. We consider how the projections have changed over time and what the projections tell us about the financial challenges ahead.
3.2
We also consider what options the 2016 Statement sets out for the Government to approach these challenges, and the implications for future long-term fiscal statements.
Projecting the financial challenge of an ageing population
3.3
The primary purpose of the 2016 Statement's financial projections is to show "that governments face long-term fiscal challenges, and they have choices about how to manage these pressures".32
3.4
To do this, the 2016 Statement analyses one future financial challenge and provides two financial projections. The first projection shows the scale of the financial challenge. The second shows how the financial challenge could be mitigated.
3.5
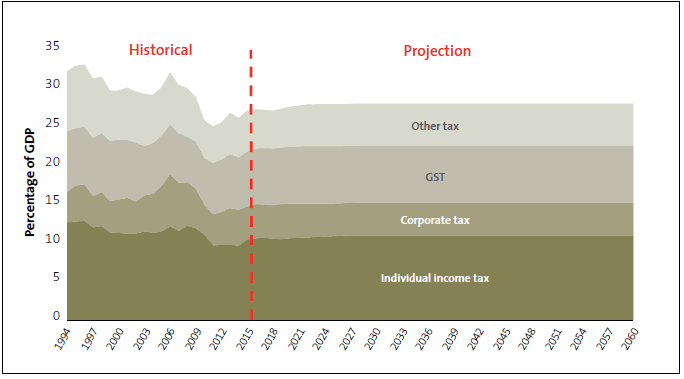
These financial projections do not always adequately reflect what could happen in the future, given the context of population ageing. As an example of what we mean, Figure 7 shows how the projected components of the Government's tax base are held constant as a share of GDP over the projection period. For comparison, we also show the same components from 1994 to 2015.
Figure 7
Projection of the components of the Government's tax base as a proportion of GDP
3.6
Figure 7 shows that, after a period of transition, the 2016 Statement's projection of taxation revenue is capped at a historical norm of 28.6% of GDP. This percentage and the proportion of the types of taxation are assumed to stay constant despite historical patterns and/or the significant changes that are anticipated to take place in the country's population structure. For example, government revenue could gradually increase above GDP growth when older people work longer or more productively (provided tax thresholds are not adjusted for rising incomes).
3.7
Although the Treasury has always been clear in explaining its approach to projections, some of the changes made to the 2016 Statement's projections incorporate a significant element of judgement and we did not always see a consistent application of projection principles. For example:
- it is unclear how far the 2016 Statement's projections are an attempt to project the future financial consequences if current policy settings are maintained, or if history is repeated "on average" and subject to limited and specific (essentially demographic-driven) future changes;
- in an internal seminar for the 2016 Statement, the Treasury noted that changing projected non-superannuation welfare expenses from a "bottom-up" to a "historical norm" approach had trade-offs that needed to be debated; and
- including the financial consequences of social investment policies appears at odds with the fixed "what-if" nature of the population-ageing projection. It raises questions about why other scenarios, such as the possibility of further crises, were not analysed.
3.8
Figure 8 shows the Treasury's projection of the long-term financial consequences of population ageing on the various components of core Crown expenditure (all in proportion to core Crown revenue, which is shown as the blue horizontal dotted line). For comparison, we also show these same components from 1972 to 2015.
3.9
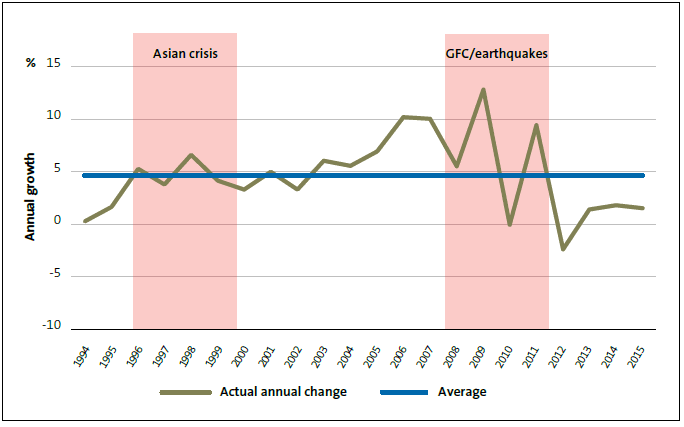
Figure 8 shows that from 1972 to 1992, the Crown was continually in deficit (that is, core Crown revenue was less than expenses). From 1993 to 2008 this position reversed – until the global financial crisis (GFC) and the Canterbury earthquakes in 2008 and 2011, respectively.
Figure 8
Comparison of core Crown expenditure and core Crown revenue
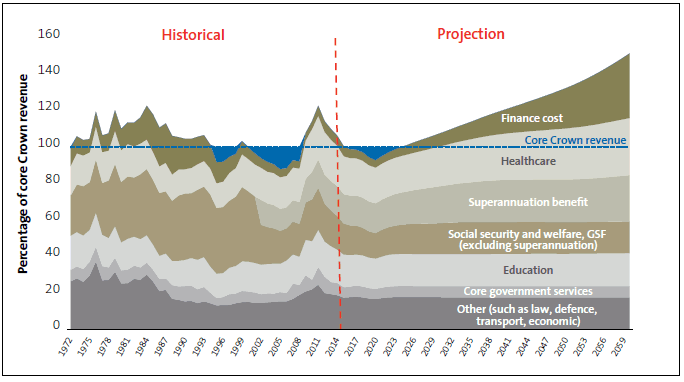
Note: The database we used separates superannuation from social security and welfare only from 2002 onwards.
3.10
There are two main reasons why, from 2016 onwards, the Government's long-term financial position is projected to become unsustainable over the long term:
- government spending continues to exceed government revenue because, as a share of GDP, tax revenue is held constant and healthcare and superannuation costs increase; and
- finance costs increase significantly because all resulting operating deficits are funded by debt.
3.11
In our view, it is difficult to imagine these assumptions would hold over a 40-year horizon because both move away from many of the principles of responsible fiscal management set out in the Act. The duration of these assumptions reduces the reasonableness of the outlook and potentially the confidence that users have in the 2016 Statement's main messages – particularly when we look at how government finances have moved in the past.
How the projection of the financial challenge compares with previous long-term fiscal statements
3.12
Figure 9 shows how the Treasury's view of the financial challenge of an ageing population has affected the Government's projected net debt to GDP ratio in each of the four statements. The figure shows how the four financial projections respond to changes in the economic and financial environment at the time of the projection (such as the GFC and the Canterbury earthquakes), current fiscal policy settings, and any modelling changes.
Figure 9
Net debt to GDP ratios in the four long-term fiscal statements
| 2016 Statement |
2013 Statement |
2009 Statement |
2006 Statement |
|
|---|---|---|---|---|
| Net debt to GDP at start of projection period | 20.5% | 27.1% | 33.7% | 7.9% |
| Net debt to GDP in 2050 | 124.4% | 118.9% | 223.4% | 98.7% |
| Change in net debt to GDP | 103.9% | 91.8% | 189.7% | 90.8% |
3.13
Although all projections show a dramatic growth in net debt to GDP by 2050, the most pessimistic outlook was in 2009, after the GFC. This suggests that current economic circumstances have a significant influence on the Treasury's projection of the long-term financial sustainability of the Government.
3.14
A high net debt to GDP ratio is not always risky but it does signal a reduction in the financial resilience of the Government and, at extreme levels, can limit the Government's ability to service debt while maintaining public services. A recent OECD report suggests that a prudent "gross" debt to GDP range is between 15% and 75%, depending on the health of the country's economy.33
3.15
As we noted in our commentary on the 2013 Statement, the net debt to GDP ratio does not fully reflect the effect of wider influences on the financial sustainability of the Government.34 It also leads to a relatively narrow focus on managing financial sustainability that could overlook the effects on the levels of quality of public services.
3.16
In our view, the Treasury could consider other approaches that reflect wider influences. The sort of approaches the Treasury could consider might include a more comprehensive balance sheet that shows a wider set of assets and liabilities, or the Integrated Reporting framework35 that shows how six possible "capitals" (financial, manufactured, intellectual, human, social and relationship, and natural) are transformed by the operations and activities of an organisation.
What the financial projection tells us about future challenges and opportunities
3.17
The 2016 Statement's projection of the financial challenge shows what could happen if population ageing resulted in increased healthcare and superannuation spending and nothing was done about it apart from financing the resulting operating deficits through increased debt.
3.18
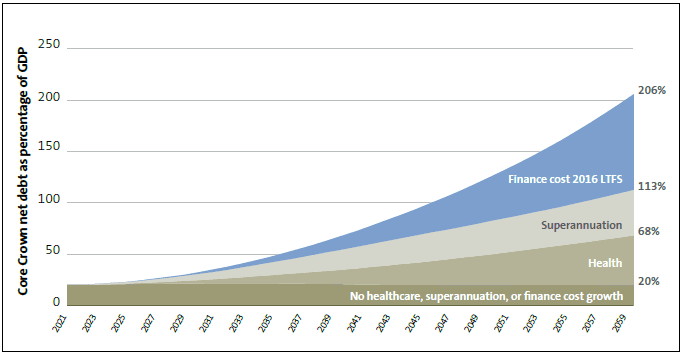
Figure 10 uses the 2016 Statement's projection of the financial challenge to show the relative importance of healthcare, superannuation, and finance costs on the Government's core Crown net debt to GDP over time.
Figure 10
Components that drive the Treasury's projection of net debt to GDP
3.19
The projection in Figure 10 shows that funding projected increases in healthcare and superannuation by debt alone will seriously compromise the financial sustainability of the Government.
3.20
As noted in Part 2, there are many other potential challenges and opportunities that could create a more uncertain future than the 2016 Statement's projections suggest. Preparing a set of scenarios that captures combinations of these opportunities and challenges would provide an important first step in generating a set of financial projections that allow important and useful insights into the future financial risks, capacity, and sustainability of the Government.
3.21
We give some simple examples below of the possible financial consequences of two other challenges the Government could face in the future.
A series of short- to medium-term negative shocks
3.22
In the last two decades, New Zealand has experienced three significant and unexpected shocks – the Asian financial crisis,36 the GFC, and the Canterbury earthquakes. These followed earlier crises:
- in around 1976, after the oil price shocks in the early to mid-1970s; and
- in the early 1990s, shortly after the global share market crash of 1987.
3.23
The timing of these shocks in the last 40 years is more frequent than the International Monetary Fund paper's finding that (on average) countries have experienced a significant fiscal shock every 12 years.
3.24
Figures 11 and 12 show how the annual growth rate of government revenue and expenses was affected by the consequences of the three recent crises. Generally, revenue growth declined and expense growth increased during those times.
3.25
These two periods of crisis, which cover three unexpected shocks, can be used as an indication of what potential financial consequences could follow another set of shocks. Given this historical evidence, it would be reasonable to assume something unexpected could happen every seven to eight years that will have an adverse effect on the Government's short-, medium-, and long-term financial position.
3.26
Applying this historical 20-year pattern of crises to the 2016 Statement's 40-year projection means it is reasonable to assume that there could be four or five potential shocks during the projection period. To be conservative, we assumed no extended recovery period and, consistent with the 2016 Statement's projection assumptions, we also assumed:
- no government policy response; and
- all resulting deficits are funded by debt.
Figure 11
Effect of crises on annual growth rate of government revenue
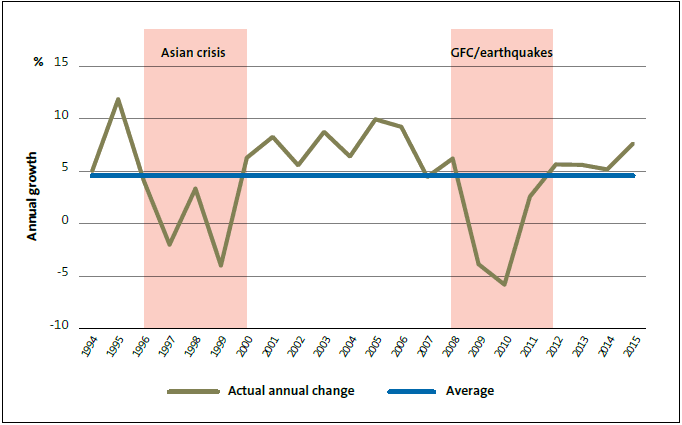
Figure 12
Effect of crises on annual growth rate of government expenses
GFC: Global financial crisis.
3.27
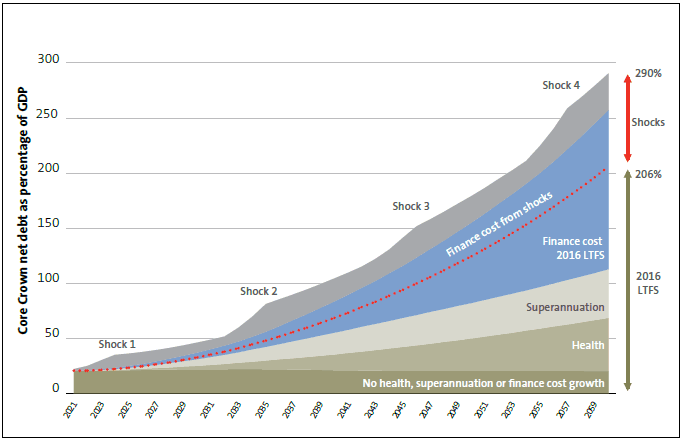
Figure 13 shows that overlaying the financial effects of four potential shocks during the projection period increases the 2016 Statement's original net debt to GDP projection in 2060 from about 206% of GDP to about 290%. In line with the Treasury's original assumptions, a significant effect of the shocks is an increasing interest cost, which we show as above the red dotted line in Figure 13.
Figure 13
Financial consequences of a regular series of shocks
3.28
Figure 13 shows that allowing for a potential series of regular shocks as well as an ageing population means not only a significant rise in the magnitude of the financial challenge but also a decline in the time available to prepare for the challenge.
3.29
The sudden increases from the four generic shocks could also mean a change in the way that financial resources are planned for and allocated to support the operational planning for these events. According to the International Monetary Fund, relying on measures such as debt funding might not always be enough or appropriate for certain risks.37
3.30
A Treasury working paper on modelling shocks also noted that although a stronger Crown balance sheet provides a buffer, it might not always be enough. That is, "in a more significant crisis the adjustment could still fall heavily on taxpayers through fairly rapid changes to tax or government spending".38
A single more enduring challenge – a foot-and-mouth disease outbreak
3.31
The unexpected shocks we described above would be regular but of only a short- to medium-term duration. After the outbreak of foot-and-mouth disease in the United Kingdom in 2001, the Reserve Bank and the Treasury analysed the likely financial impact for the Government of an outbreak in New Zealand. They found that the financial consequences would be significant and enduring.39
3.32
The paper was careful to note that an event of this nature would have many uncertainties that cannot be easily captured and modelled. For example, the reactions of trading partners and the effect on the financial sector were factors that were not included.
3.33
The paper considered the likely effect on government revenue to GDP and expenses to GDP in the first nine years of the crisis. We used these same ratios and applied them to GDP levels in the 2016 Statement's projection model to approximate the potential effect of a foot-and-mouth disease outbreak starting in 2021. Although the paper implied that government expenses could continue to increase, we held these constant.40
3.34
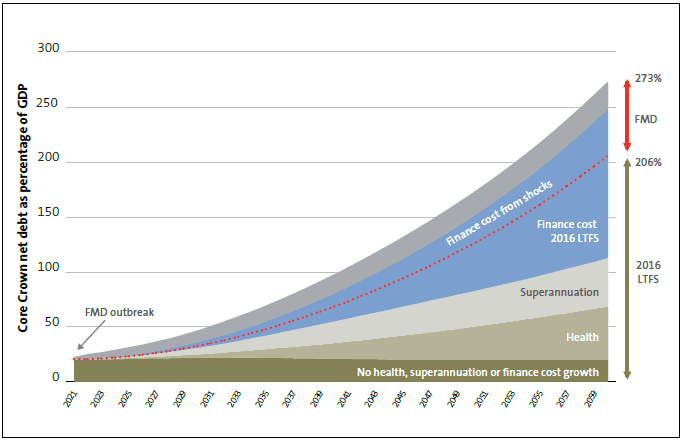
Figure 14 shows the likely effect of a foot-and-mouth disease outbreak when added to the superannuation and healthcare increases shown in the 2016 Statement. Based on the comments in the information paper, the potential effect shown in Figure 14 is likely to be conservative.
3.35
We did not allow for any ongoing increase in government expenses. If we allowed for government expenses to increase, the net debt to GDP in 2060 would increase to about 357%. This additional impact would be greater than the impact of projected increases in superannuation or healthcare spending alone.
3.36
As we saw in allowing for a regular pattern of potential shocks to occur (Figures 11 and 12), an enduring shock means not only a significant rise in the size of the challenge, but also that there is less time available to financially prepare for the challenge.
3.37
Furthermore, because of the potential scale, complexities, and wide-ranging effects of such a challenge, the usual post-disaster funding strategies – such as reallocating spending, increasing taxes, borrowing money, or applying for international aid – could become difficult, costly, or not timely enough.
Figure 14
Financial consequences of a foot-and-mouth disease outbreak compared to superannuation and healthcare increases
FMD: Foot-and-mouth disease. LTFS: Long-term fiscal statement.
What options are there to manage the financial challenge of population ageing?
3.38
Various options are mentioned in the 2016 Statement as examples of ways to lessen the financial challenge of an ageing population:
- reducing government expenditure as a share of GDP (except superannuation spending) to a level where net debt to GDP stays at about 20%;
- improving various social investment outcomes through initiatives such as achieving the Better Public Services targets, raising human capital levels through health and education improvements, and reducing regional disparities in measures of well-being; and
- individually adjusting other factors such as higher net migration and productivity growth, a higher goods and services tax rate, a higher eligibility age for superannuation, or indexing the superannuation payments to inflation rates.
3.39
There is also some discussion of the fiscal buffer provided by the 20% net debt to GDP target.
3.40
The options refer back to some earlier parts of the 2016 Statement and demonstrate that there are many ways to lessen the financial challenge of an ageing population. However, the way the analysis of these options is prepared and presented in the 2016 Statement limits their usefulness in informing and developing potential funding strategies to mitigate, provide for, or accommodate the financial challenge.
3.41
The options are analysed individually and sometimes inconsistently. Some also include questionable assumptions. For example:
- except for two possible changes in parts of the tax base, the financial projections still assume all Crown revenue will remain constant as a share of GDP;
- the feasibility of holding constant or reducing many areas of government expenditure in the long term is questionable and "how feasible" is not examined;
- some of the analysis does not show the effect on net debt to GDP41 so it is difficult to compare with the option to stabilise net debt at 20% of GDP;
- combinations of options are not considered and, because of potential differences in the timing of implementation, the relative importance of these options might change when measured against the change in net debt to GDP; and
- except for one, all social investment opportunities assume the achievement of dramatic changes in social conditions with no new public spending.
3.42
Other potentially relevant approaches were also not analysed or compared – such as combining certain options, the use of targeted reserves, reducing the net debt target, or greater contributions, either to or from the New Zealand Superannuation Fund. As part of our work we attempted to find out what would happen if the New Zealand Superannuation Fund performed better or worse than expected. We found two issues:
- the way the projection model incorporates the New Zealand Superannuation Fund is overly complicated and does not allow a clear analysis of what would happen if the Fund performed better or worse; and
- most of the value of the New Zealand Superannuation Fund for offsetting future superannuation costs is after the end of the projection period.
3.43
We discuss both of these issues further in Part 4.
Implications for future long-term fiscal statements
3.44
Our additional analysis of shocks is simple and could be improved on. The possible scenarios we analyse include a combination of only two possible challenges. They are intended as examples of the many potential challenges that could affect the ability of future governments to service debt obligations while maintaining levels of public services.
3.45
Climate change is another example of a potentially severe and enduring challenge. The United Kingdom's Stern Review of 2006 noted that:
Using the results from formal economic models, the Review estimates that if we don't act, the overall costs and risks of climate change will be equivalent to losing at least 5% of global GDP each year, now and forever. If a wider range of risks and impacts is taken into account, the estimates of damage could rise to 20% of GDP or more.42
3.46
In our view, the 2016 Statement could have done more to prepare a set of financial projections of different but plausible scenarios that captured combinations of likely future opportunities and challenges.
3.47
This information would have provided the first step in preparing management and funding strategies that best reflect the potential nature, scale, and timing of uncertainties and their likely effect on future governments' finances. Potential strategies could include various post-disaster and pre-disaster funding methods, which could then be tested for suitability as part of the scenario and financial projection analysis.
32: The Treasury (2016), He Tirohanga Mokopuna: 2016 Statement on the Long-Term Fiscal Position, Wellington, page 3.
33: Gross debt makes no deduction for financial assets, so prudent net debt ranges will be lower than these OECD prudent ranges. See OECD (July 2015), "Achieving prudent debt targets using fiscal rules", OECD Economics Department Policy Notes, No. 28, page 1.
34: Discussed in more detail in our report, Commentary on Affording Our Future: Statement on New Zealand's Long-term Fiscal Position (2013).
35: International Integrated Reporting Council (2013), The International <IR> Framework, London, page 13.
36: During the Asian financial crisis, a serious drought also affected large parts of the country (over the summer of 1997/1998).
37: International Monetary Fund (2016), Analyzing and Managing Fiscal Risks – Best Practices, Washington DC, pages 21-24.
38: Fookes C (2011), Modelling Shocks to New Zealand's Fiscal Position, page 27.
39: The Treasury and the Reserve Bank of New Zealand (2003), The macroeconomic impacts of a foot-and-mouth disease outbreak: an information paper for Department of the Prime Minister and Cabinet, pages 5 and 7.
40: The expense to GDP ratios in the 2003 paper included interest costs. We adjusted these ratios downwards to exclude the likely effect of interest costs.
41: However, we understand that some net debt to GDP analysis is contained in background papers to the 2016 Statement.
42: HM Treasury (2006), Stern Review Report on the Economics of Climate Change, London, page vi.

